Subprime Auto DQ Hits 17.68%, a September Record
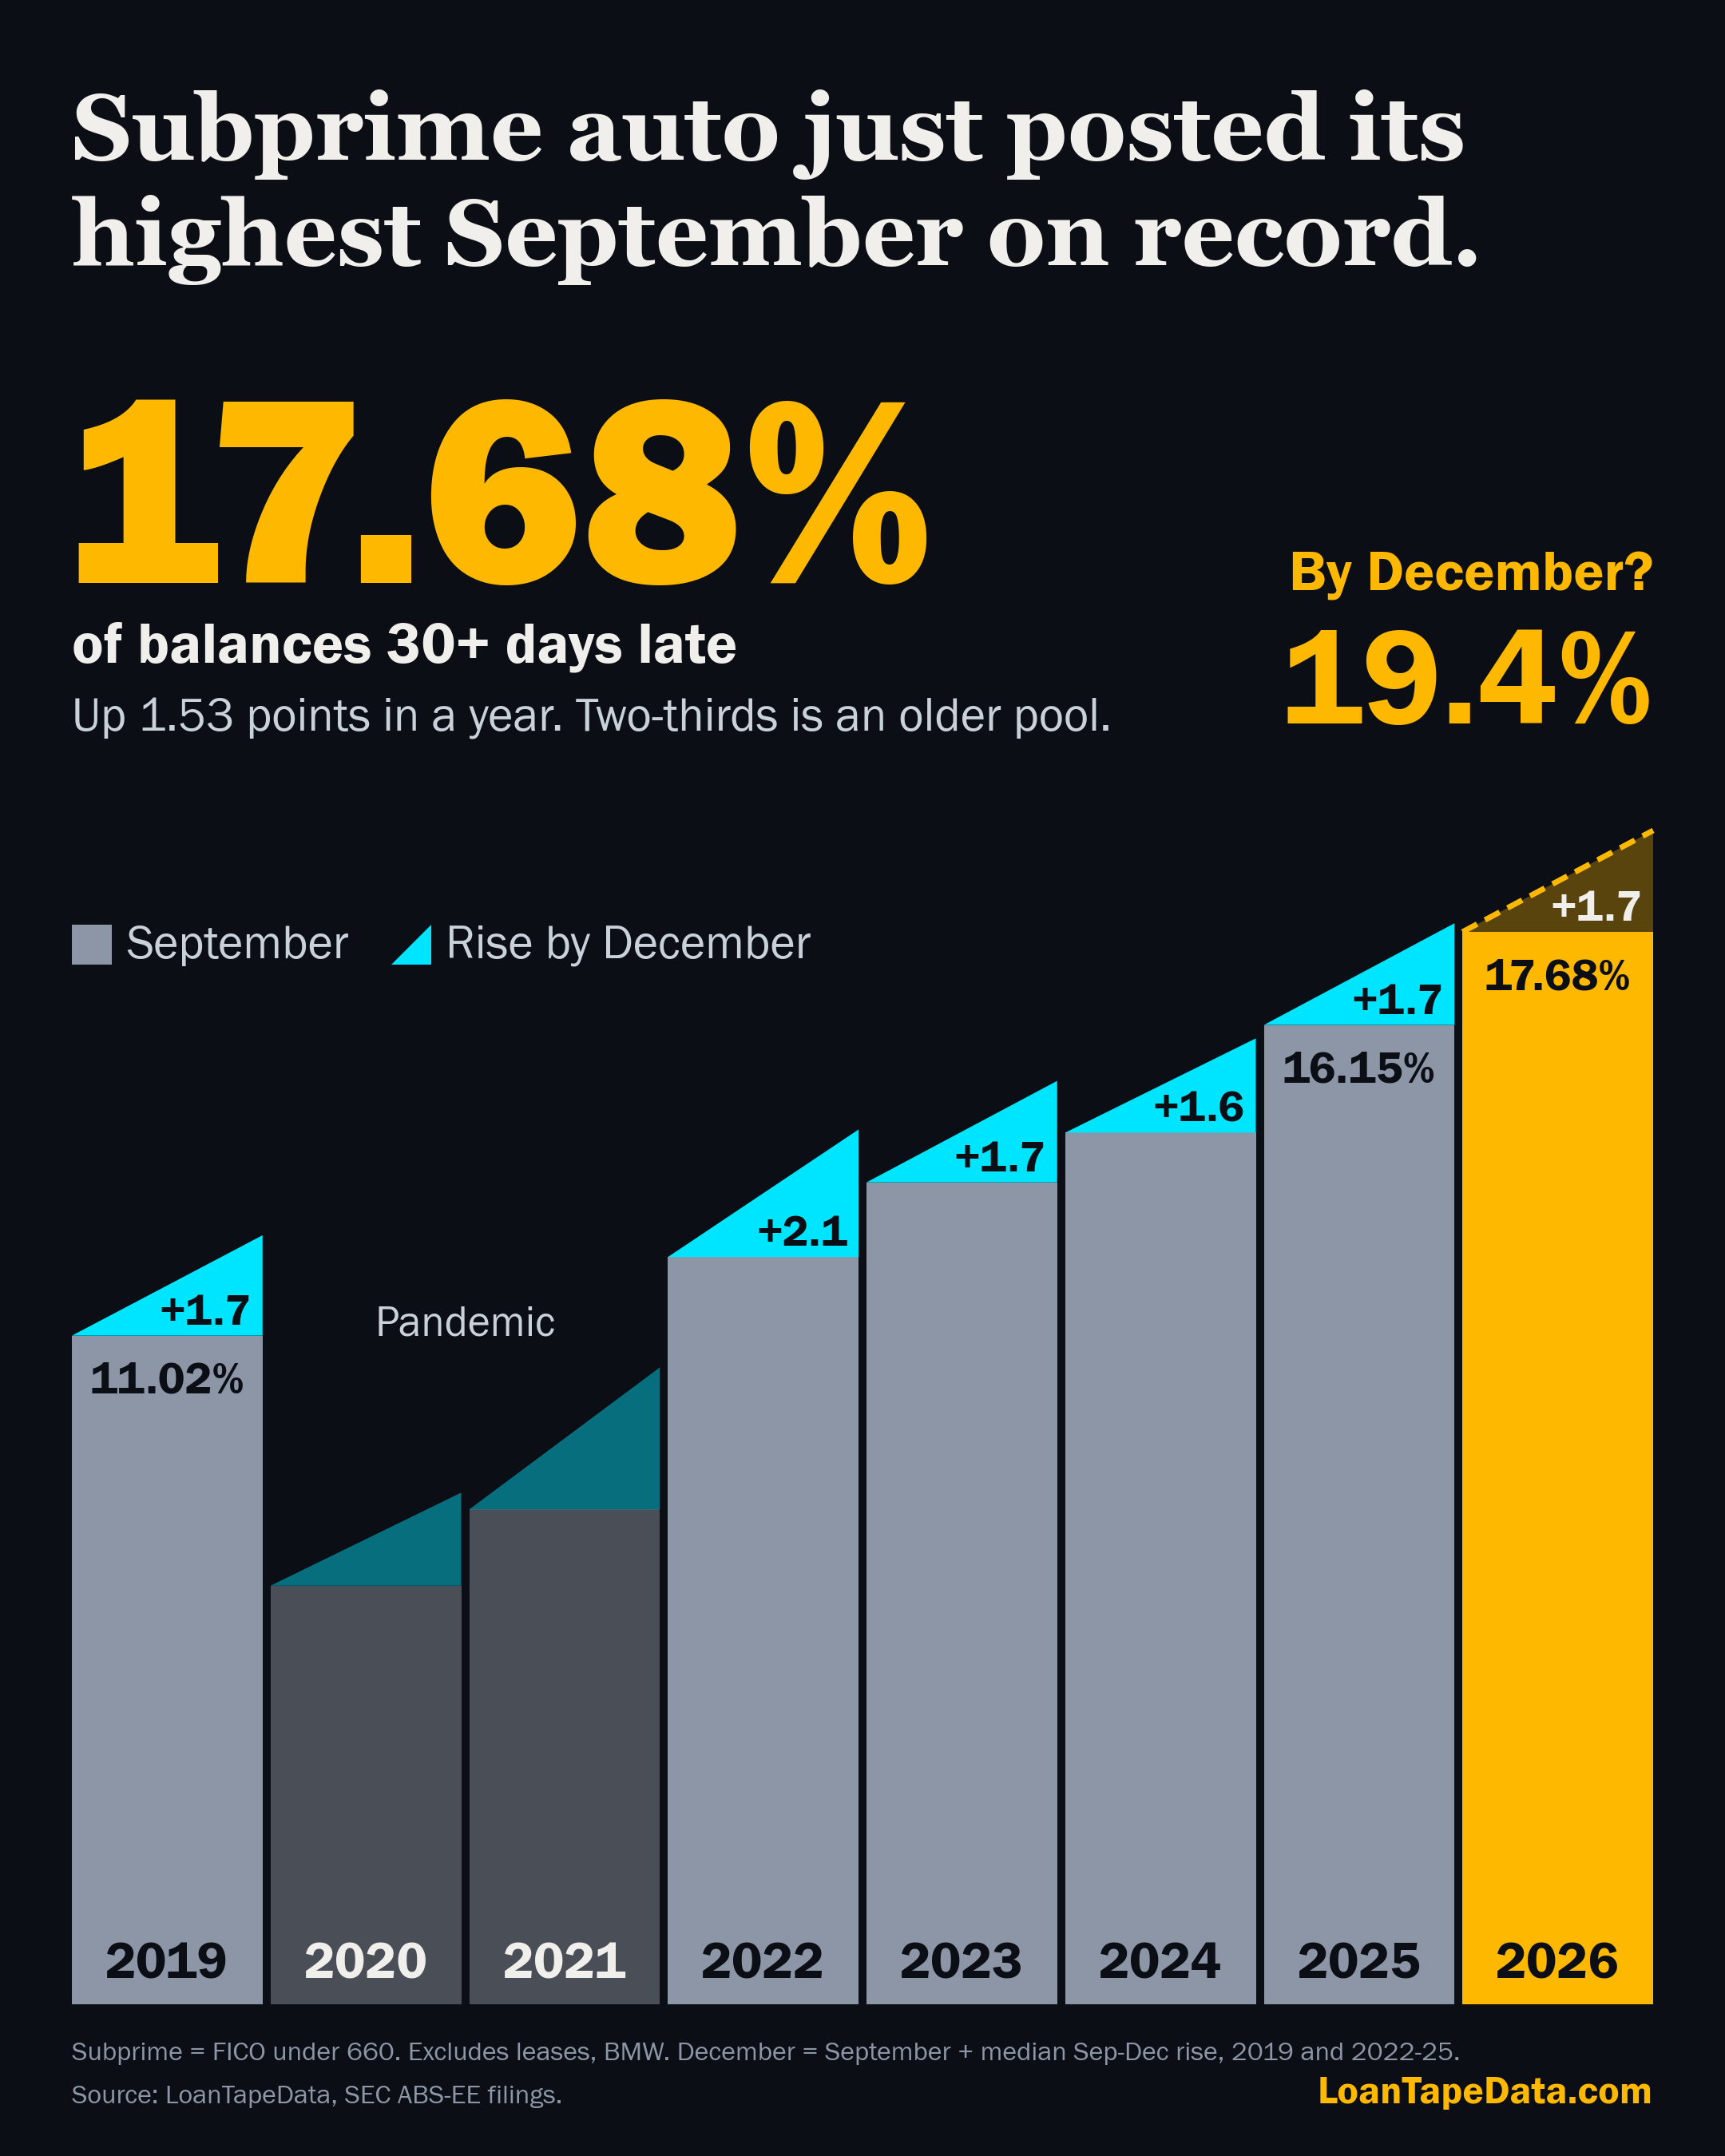
Subprime auto ABS delinquency at 30 or more days past due (DPD) reached 17.68% of balance in September 2026, the highest September in filings going back to 2017. That is 153 basis points above September 2025. Holding issuer and deal age fixed, the rise is 52 bps. The other 101 bps comes from a change in the pool itself.
The record
Only one month in the data sits higher: December 2025, at 17.82%. Every month of 2026 so far is the highest on record for its calendar month, and the gap to the same month of 2025 has ranged from 40 bps in July to 166 bps in February.
| September | 30+ DPD | 60+ DPD | Subprime balance |
|---|---|---|---|
| 2019 | 11.02% | 3.43% | $29.3B |
| 2022 | 12.32% | 4.43% | $40.8B |
| 2023 | 13.55% | 4.96% | $40.4B |
| 2024 | 14.37% | 5.25% | $45.9B |
| 2025 | 16.15% | 6.24% | $47.4B |
| 2026 | 17.68% | 7.00% | $40.6B |
The 60+ figure of 7.00% is level with December 2025's 6.99%. The balance column shows a second change: subprime balance fell 14% in a year while the rate rose.
These figures come from the loan-level ABS-EE filings I parse for each trust. Subprime here means a FICO score under 660, at the loan level, across every issuer. It is not a list of subprime shelves.
Splitting the rise
To separate performance from composition, I grouped subprime balance by issuer and deal year, then measured the change inside each group at last September's balance weights. That holds both issuer and deal age fixed. The groups cover 94% of September 2025 balance.
| September vs. prior September | Total | Same issuer, same deal age | Rest (mix) |
|---|---|---|---|
| 2023 | +123 bps | +13 bps | +110 bps |
| 2024 | +82 bps | +80 bps | +1 bp |
| 2025 | +178 bps | +98 bps | +80 bps |
| 2026 | +153 bps | +52 bps | +101 bps |
The like-for-like rise slowed from 98 bps to 52 bps while the headline stayed above 150 bps. Mix has been large before, in 2023 and 2025. In 2024 it was close to zero.
Holding deal age alone gives a smaller number: +13 bps of rate change and +141 bps of age mix. I would not use that split. Santander and Drive, the two highest-delinquency issuers in this group, went from 38% of subprime balance to 30%, and that shift pulls the age-only figure down. Holding issuer as well removes it, which is why 52 bps is the number I report.
Why the pool is older
The largest change is in new deals. Balance in deals issued in the same calendar year fell from $19.5B last September to $11.5B. Those deals run the lowest delinquency, so losing their weight lifts the average even if nothing else changes.
| Deal age at September | Share of balance, 2025 | Share of balance, 2026 | 30+ DPD, 2025 | 30+ DPD, 2026 |
|---|---|---|---|---|
| Same year | 41.1% | 28.3% | 9.33% | 9.81% |
| 1 year | 30.1% | 35.4% | 18.74% | 17.82% |
| 2 years | 14.7% | 21.7% | 20.40% | 22.56% |
| 3 years | 9.7% | 9.9% | 24.43% | 23.38% |
| 4+ years | 4.4% | 4.8% | 29.47% | 29.29% |
Balance-weighted deal age rose from 1.07 years to 1.28 years. Within the age buckets the record is mixed: one- and three-year-old deals are lower than a year ago, and two-year-old deals are 216 bps higher.
Three issuers account for most of the drop in same-year balance:
| Issuer | Same-year trusts, Sept. 2025 | Same-year trusts, Sept. 2026 | Same-year subprime balance, 2025 | Same-year subprime balance, 2026 |
|---|---|---|---|---|
| Santander | 3 | 1 | $4.04B | $1.08B |
| Drive | 2 | 0 | $2.58B | $0.00B |
| Exeter | 8 | 5 | $5.55B | $3.80B |
I checked the Santander and Drive counts against the SEC's registrant list as well as my own filing manifest, because a gap in discovery would produce the same pattern. EDGAR shows Santander Drive Auto Receivables Trust 2026-1 and no 2026 trust on the Drive shelf. Filings do not explain issuance decisions, and I cannot say from this data why the volume changed.
The count only includes trusts with a September reporting period. Deals such as Bridgecrest 2026-4 and CarMax 2026-4 have filed a first ABS-EE and will enter the panel later, and the September 2025 count carries the same reporting lag. I track new trusts as they appear in monthly trust adds.
By issuer
These are raw issuer rates, not like-for-like. A shelf with few new deals ages faster than one issuing regularly, and that shows up here.
| Issuer | Balance, Sept. 2026 | 30+ DPD, Sept. 2025 | 30+ DPD, Sept. 2026 | Change |
|---|---|---|---|---|
| Exeter | $10.9B | 16.86% | 18.29% | +143 bps |
| Santander | $9.3B | 21.51% | 23.67% | +216 bps |
| Bridgecrest | $4.7B | 16.12% | 19.60% | +348 bps |
| CarMax | $3.6B | 12.05% | 12.63% | +58 bps |
| Drive | $3.0B | 18.41% | 26.40% | +798 bps |
| GM | $2.4B | 12.47% | 13.74% | +127 bps |
| Carvana | $2.1B | 8.97% | 6.11% | -287 bps |
Of the 12 issuers with at least $0.5B of subprime balance, 10 rose. Carvana and Ford were lower. Drive's 798 bps sits on a shelf with no 2026 trust in the data.
Vintages
Comparing deals at the same point in their reporting life gives a second read. I measured each deal year at a fixed number of months after a trust's first report. That is not months since origination, but it is consistent across deal years.
| Deal year | 12 months | 18 months | 24 months | 12 months, ex Santander and Drive | 18 months, ex Santander and Drive |
|---|---|---|---|---|---|
| 2022 | 14.53% | 17.61% | 18.53% | 12.36% | 14.78% |
| 2023 | 13.71% | 16.56% | 18.55% | 11.94% | 14.12% |
| 2024 | 15.69% | 19.49% | 21.37% | 13.46% | 16.63% |
| 2025 | 15.77% | 18.62% | n/a | 14.02% | 16.50% |
Deals from 2024 are the highest in this set. They are the two-year-old bucket above, 21.7% of balance, and the bucket whose rate rose most in the year. Deals from 2025 look better at 18 months in the full set, 18.62% against 19.49%. Excluding Santander and Drive, the gap nearly closes, 16.50% against 16.63%, so most of that improvement is composition. For the longer record by vintage, see the realized record.
Prime moved differently
Prime, a FICO score of 660 or above, was 1.65% in September, up 15 bps and the highest September on record. Only November 2025 through January 2026 were higher, peaking at 1.72%. The split runs the other way from subprime: +18 bps like-for-like, with mix at -3 bps.
Among prime issuers above $5B, WorldOmni rose 47 bps, CarMax 30 bps, Toyota 24 bps and Honda 21 bps. Nissan fell 39 bps and Hyundai was flat. I covered the breadth of the prime move in an earlier post.
What to watch into December
September is not the seasonal high. Subprime rose further from September to December in every year shown here.
| Year | September | December | Change |
|---|---|---|---|
| 2019 | 11.02% | 12.68% | +166 bps |
| 2022 | 12.32% | 14.42% | +210 bps |
| 2023 | 13.55% | 15.22% | +167 bps |
| 2024 | 14.37% | 15.93% | +156 bps |
| 2025 | 16.15% | 17.82% | +168 bps |
Adding the median of those moves to this September gives 19.35% for December 2026, with a range of 19.23% to 19.78%. That is seasonal arithmetic and not a model estimate. Those moves were measured on younger pools, and the path is not smooth: October 2025 fell 36 bps before the climb resumed.
I would watch two things in the October filings. One is the like-for-like figure, which separates performance from aging. The other is same-year deal balance, because the mix effect depends on whether new supply returns.
Data note
The data covers ABS-EE filings accepted through October 29, 2026. Rates are balance-weighted, using each loan's reported delinquency status at the reporting period end, with a null status counted as current. Auto loan trusts only: including lease trusts, the September figure is 17.02%, against 15.65% a year earlier.
BMW is excluded from every month because its September filing was not in. Adding it moves August subprime by 2 bps. Loans without a usable credit score are excluded from both segments, and that share varies by issuer. Deal year comes from the trust name, which is a coarse measure of age. Filings after this date, and amendments, may revise these figures.
Loan-level data behind this analysis is available through the ABS-EE dataset, with access options on the pricing page.