Prime Auto's May Delinquency Jump Was Broad, Not One Lender
Data correction, July 31, 2026: This article preserves an earlier partial-panel loan-and-lease analysis. The approved complete-month, loan-only May dashboard reads 1.63% 30+ DPD for prime and 16.21% for subprime. Use the Auto ABS Performance Tracker for the current public snapshot and metric definitions.
Prime auto ABS 30+ day delinquency rose 0.16 points in May 2026, to 1.67%. That is the biggest May increase on prime in the dataset going back to 2017. In the same month, subprime rose 0.40 points, which sounds worse until you check the history: for subprime, a 0.40 point May is a completely normal month.
So the loud part of the print was the quiet part of the book. The slice everyone treats as the safe collateral moved more against its own past than the slice everyone watches.
Prime ran hot, subprime ran normal
Put both segments on their own May history and the split is clean. I pooled every issuer in the SEC ABS-EE files, weighted by pool balance, and split prime at FICO 660+ at origination. The thermometer for each segment tops out at its biggest May on record, and the arrow marks the middle of its usual May move, the 25th to 75th percentile across 2017 through 2025.
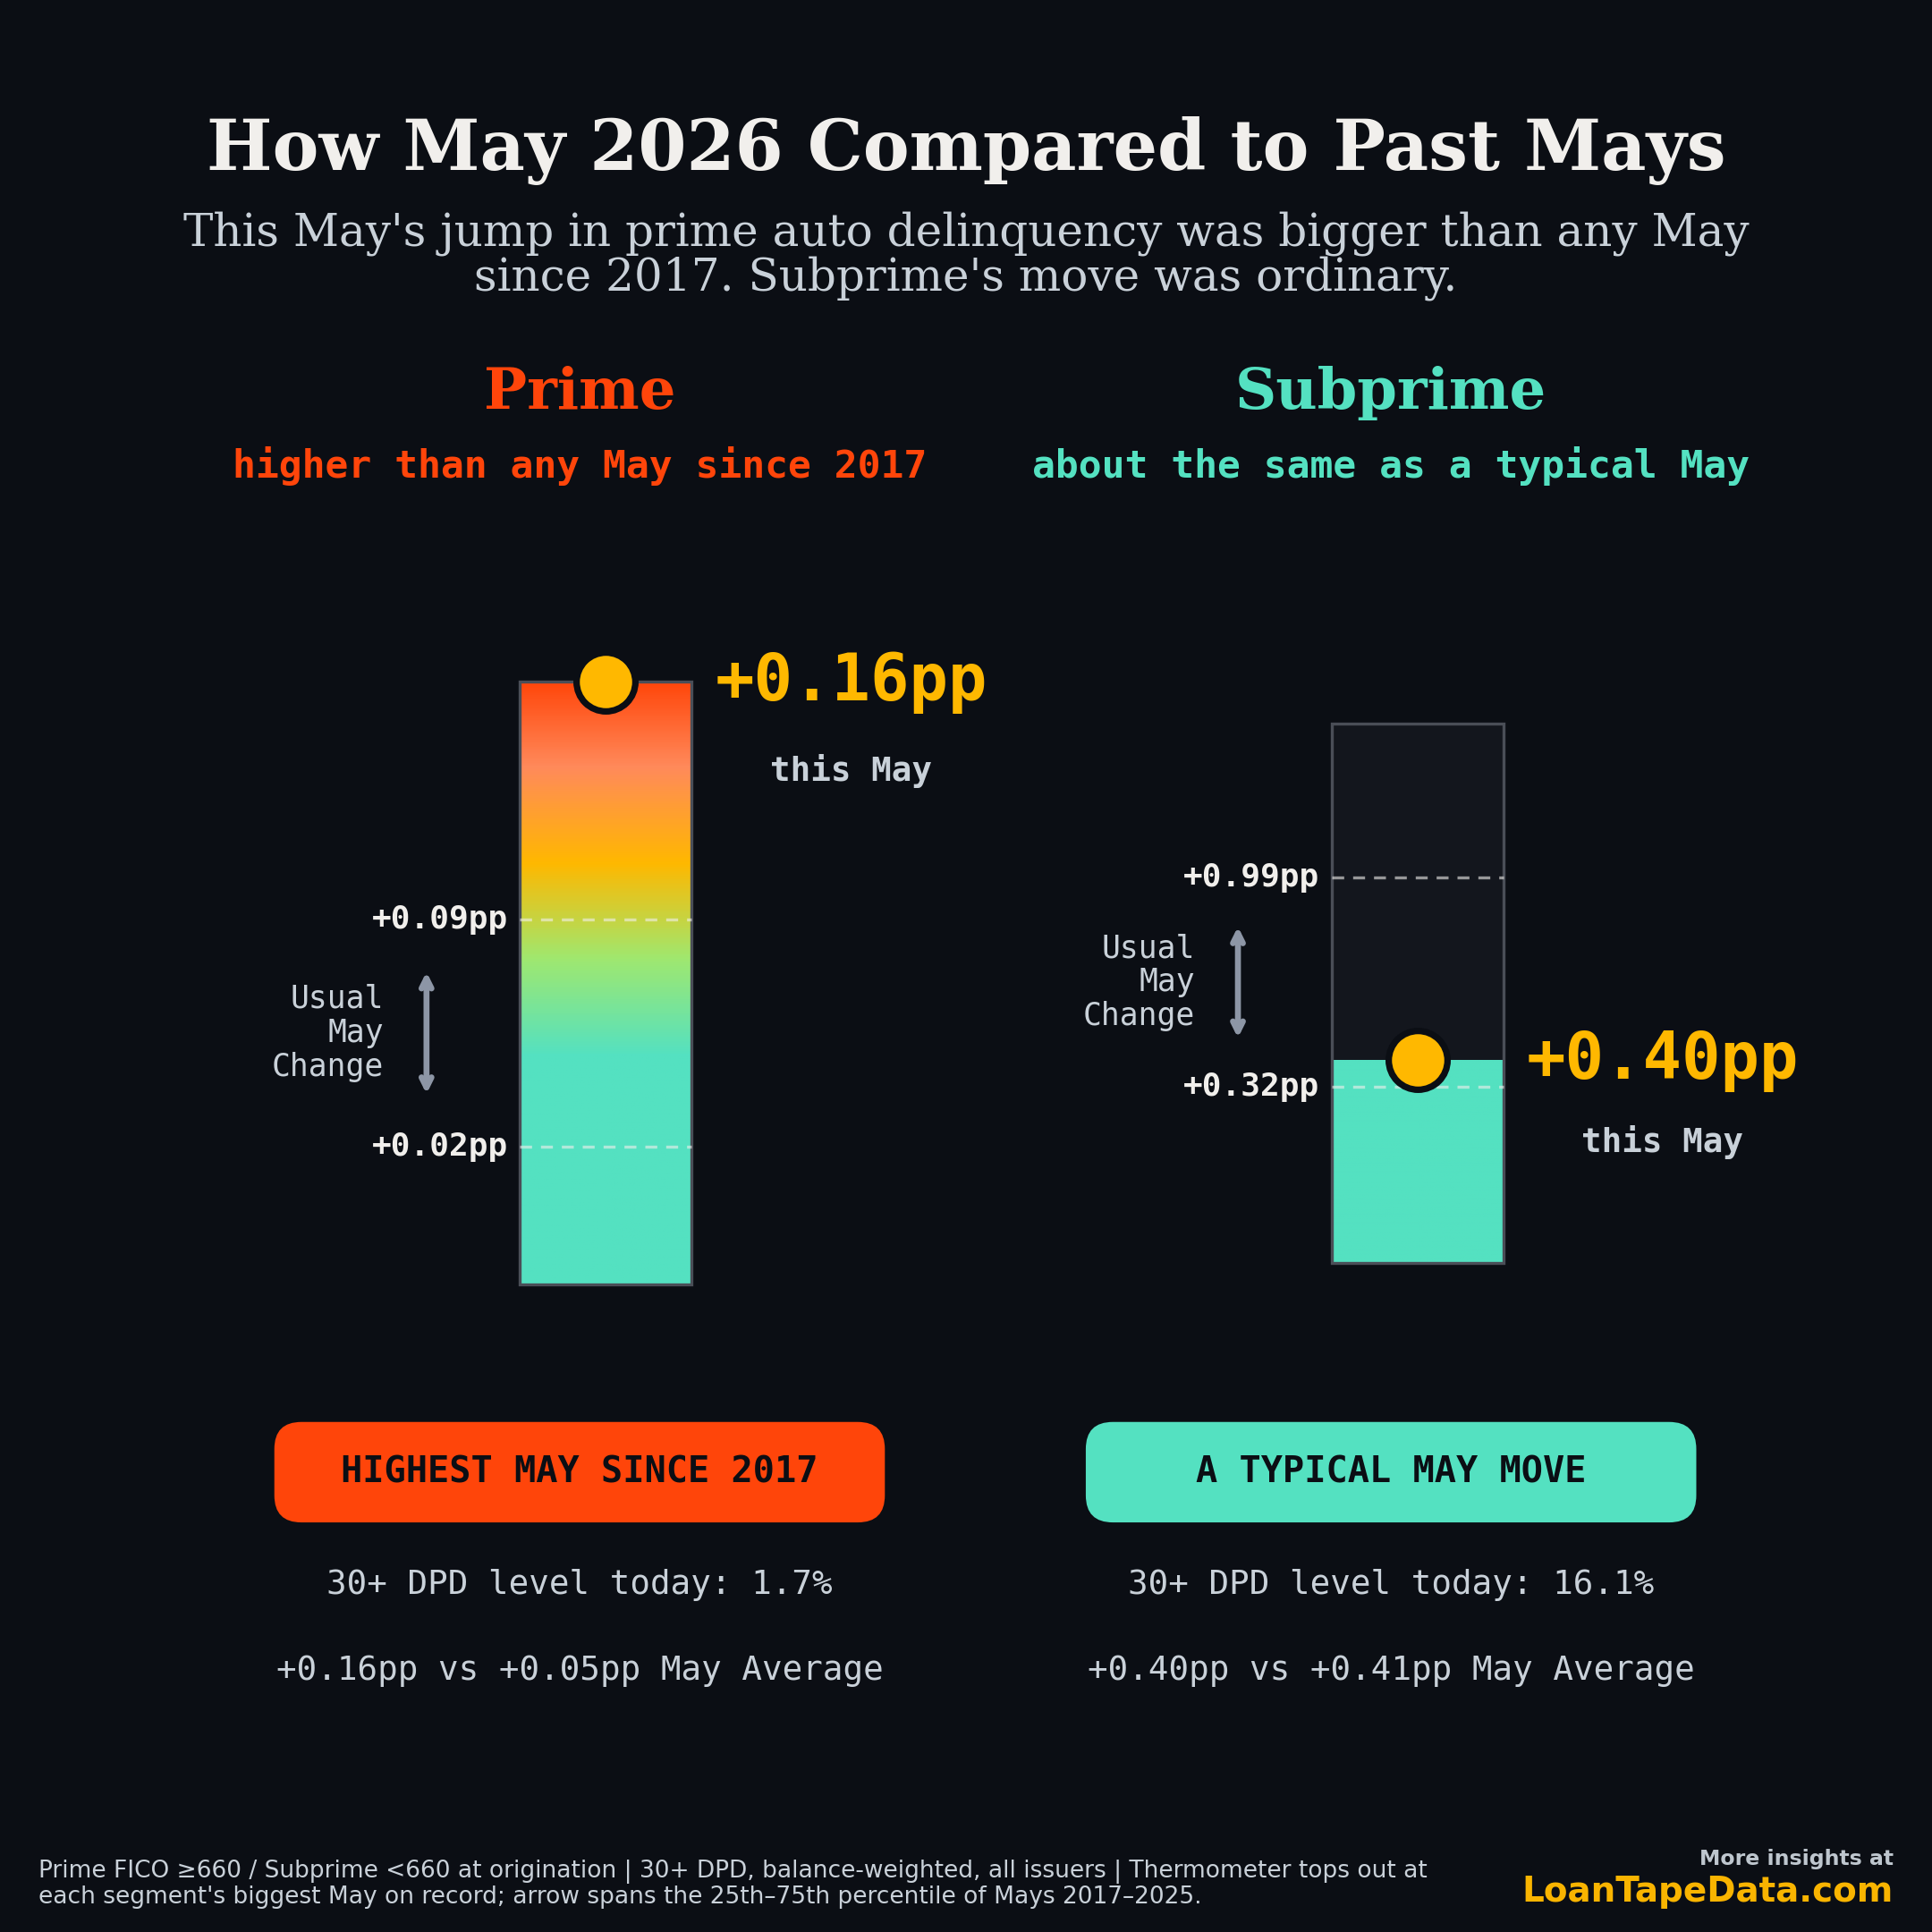
Prime's usual May adds somewhere between 0.02 and 0.09 points. This May added 0.16, well past the top of that range and above every May since the series began. Subprime's usual May runs anywhere from 0.32 to 0.99 points, a much wider spread because subprime is volatile by nature. Its 0.40 point move landed right in the fat middle of that band, a hair under its 0.41 point May average.
| Segment | This May | Usual May (25th-75th) | May average | Read |
|---|---|---|---|---|
| Prime (FICO 660+) | +0.16pp | +0.02 to +0.09pp | +0.05pp | highest May since 2017 |
| Subprime (<660) | +0.40pp | +0.32 to +0.99pp | +0.41pp | an ordinary May |
Absolute levels still sit where you expect. Prime 30+ DPD is 1.67%, subprime is 16.1%. Nobody is confusing the two. The point is direction against history, and on that measure prime is the one doing something new.
Inside prime, no single bad actor
The obvious next question on a record prime month is whether one lender dragged the number. It did not. Rank each prime issuer by its own month-over-month change, with no pool weighting, and the bars sit almost entirely on the same side of zero.
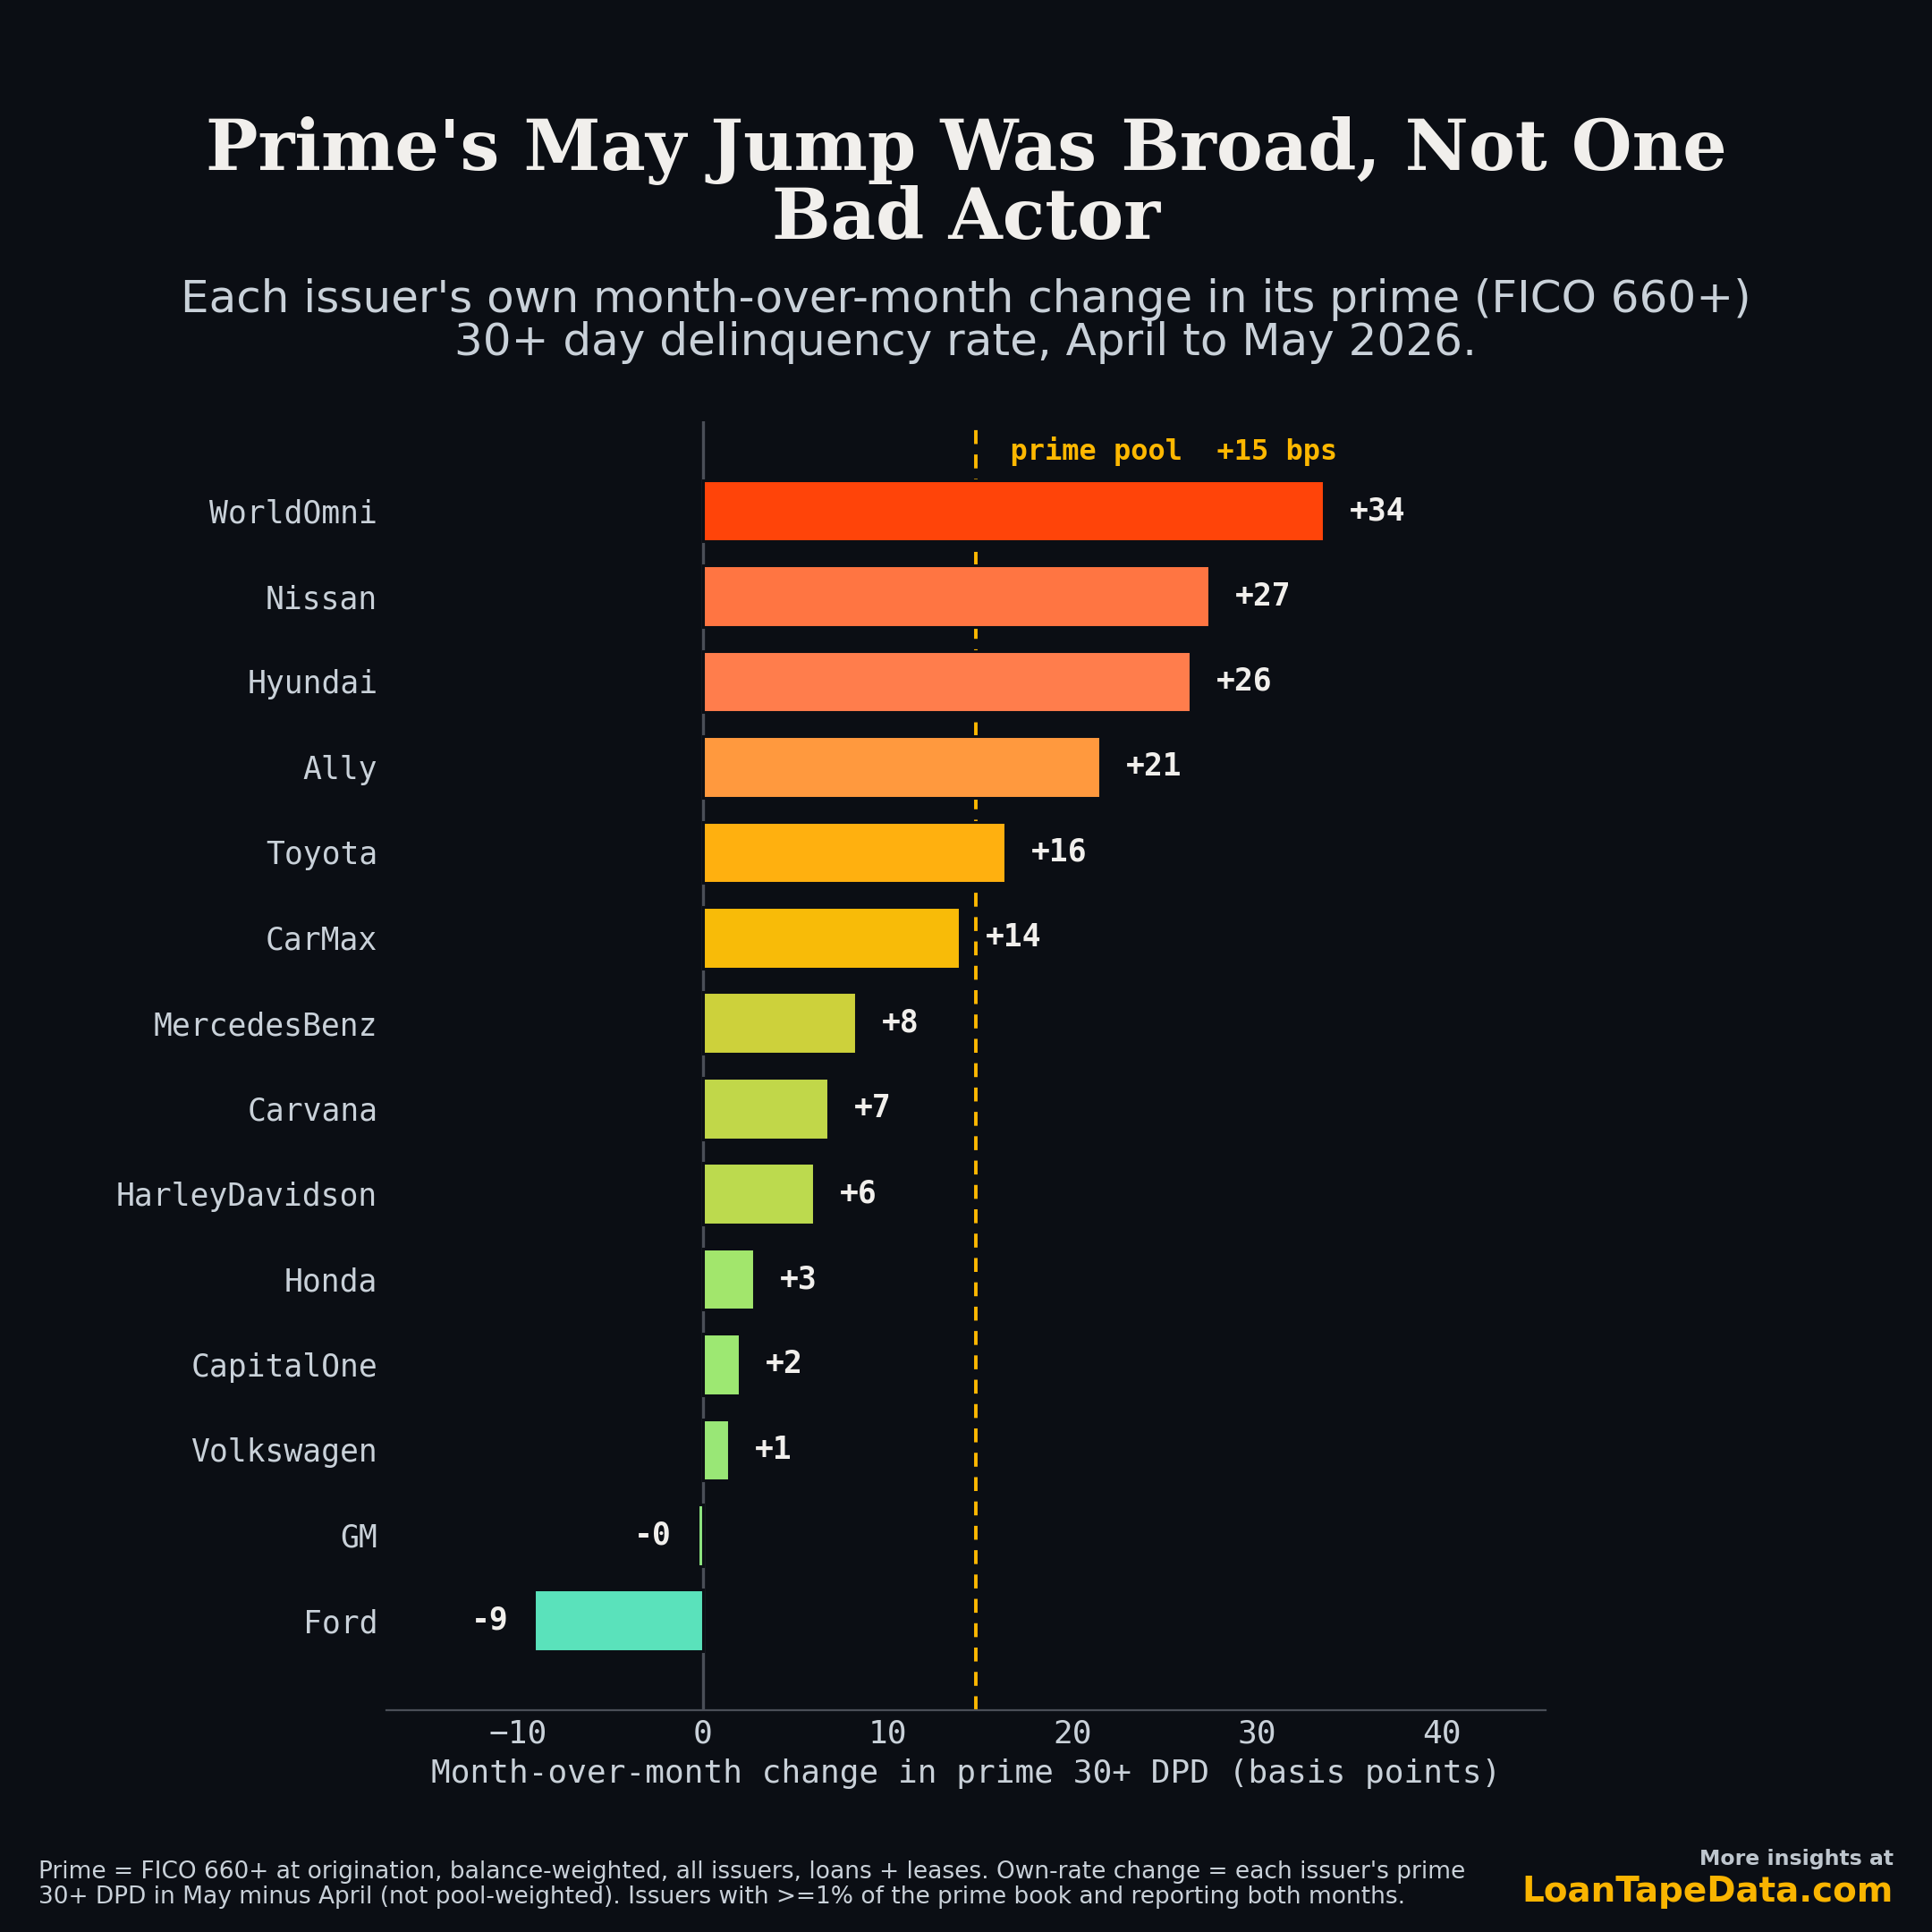
Twelve of the fourteen largest prime books rose. WorldOmni led at +34 bps, its prime book running from 1.78% to 2.12%. Nissan and Hyundai followed at +27 and +26, both off very low bases. Ally, Toyota, and CarMax filled in the +14 to +21 range. Only Ford improved, down 9 bps, and GM held flat.
| Issuer | April | May | Change |
|---|---|---|---|
| WorldOmni | 1.78% | 2.12% | +34 bps |
| Nissan | 0.39% | 0.66% | +27 bps |
| Hyundai | 0.91% | 1.17% | +26 bps |
| Ally | 2.07% | 2.28% | +21 bps |
| Toyota | 0.99% | 1.15% | +16 bps |
| CarMax | 1.54% | 1.68% | +14 bps |
| GM | 1.40% | 1.39% | flat |
| Ford | 0.61% | 0.52% | -9 bps |
The spread matters as much as the direction. The biggest mover is about two and a half times the pool average, not ten times. There is no outlier bar towering over a flat field, which is the signature of a broad move rather than an idiosyncratic one. If a servicing issue or an underwriting miss were driving the print, one name would carry it. Instead the import captives carried it together, and the two domestic captives sat it out.
One caveat keeps the chart honest. A few names people think of as auto lenders, Exeter and Santander among them, run a FICO 660+ slice that still behaves nothing like prime. Exeter's 660+ book went 9.7% to 10.5% and Santander's 11.7% to 12.3% in May, moves of 84 and 61 basis points. Those are real, but they sit on thin books at double-digit base rates, so they are a subprime story wearing a prime FICO tag. A 660 at Santander is not a 720 at Toyota. I pulled them off the scale so they would not distort the read on the lenders whose books are actually prime.
What broad usually means: the borrower, not the lender
When a move is this even across issuers, the cause is rarely on the supply side. It is the borrower. Two cuts in the same pull point the same way.
Sort the whole pool by payment-to-income and the May jump grows with the payment burden. The lightest-strain borrowers, under 8% PTI, rose 26 bps. The 12 to 16% band rose 61, and the 16 to 20% band rose 68. Higher payment relative to income, bigger May move, in a clean staircase. That is an affordability signal, and affordability does not care which logo is on the retail installment contract.
| Payment-to-income | May 2026 m/m change |
|---|---|
| Under 8% | +26 bps |
| 8-12% | +43 bps |
| 12-16% | +61 bps |
| 16-20% | +68 bps |
| 20%+ | +46 bps |
Geography tells the same story with a regional accent. The hottest states by own-rate move were South Carolina and Maryland at +67 bps, North Carolina at +65, and Florida at +61, a Southeast and Mid-Atlantic tilt. Florida and Texas, both large and both warm, did the most to move the national number. None of that lines up with any one issuer's footprint. It lines up with where stressed borrowers live.
This connects to the longer arc we have been posting. Prime 30+ DPD has been resetting to a higher floor every year, and the affordability math that drove the subprime affordability reset has been working its way up the credit box. A broad, PTI-graded, geography-graded record May on prime is what that migration looks like month to month.
What to watch
May is one print, and one print inside a seasonally soft window. A few things would tell you whether the broad drift is settling in or passing through.
- June by issuer. If WorldOmni, Nissan, and Hyundai give some of the May move back, this was a shared seasonal wobble. If they hold and a few more names cross above the pool line, the top of the credit box is repricing in real time.
- Whether prime stays outside its band. One record May is a data point. A June that also clears the usual range turns the gauge from a spike into a trend.
- Ford and GM. The two that sat out are the ones to watch for confirmation. If the domestic captives stay flat while the imports keep climbing, that is a composition and vintage story worth pulling apart at the loan level.
The asset-level view behind both charts is the ABS-EE dataset, drawn from a warehouse with 42.2 million ingested Auto ABS assets across 20 tracked issuer families. Its separate classified reporting layer contains 35.4 million loan contracts and 6.7 million lease contracts. The State of Auto build ships these prime, subprime, and issuer cuts each month as new filings land. Subscription tiers are on the pricing page.
Methodology
- Source: SEC ABS-EE filings parsed into LoanTape's loan-level cache, deduped to one record per loan per reporting month by latest filing.
- Metric: 30+ days past due as a share of pool balance, balance-weighted, loans and leases.
- Segments: prime is FICO 660+ at origination, subprime is below 660, pooled across all issuers.
- Gauge: month-over-month change in each segment's 30+ DPD for May, against the distribution of May moves from 2017 through 2025. The thermometer maxes at each segment's largest May on record; the arrow spans the 25th to 75th percentile.
- Issuer view: own-rate change is each issuer's May prime 30+ DPD minus its April, not pool-weighted. Restricted to issuers with at least 1% of the prime book that reported both months. BMW is excluded because its May file had not landed at pull time, which would otherwise register as a phantom improvement.