VantageScore vs FICO: Same Loans, Same Risk Ranking
On the same 129,768 auto loans, FICO ranks borrowers by risk with a Gini of 0.50. VantageScore comes in at 0.49. Every one of these loans carries both scores at origination, so the comparison holds the borrower, the lender and the loan terms fixed and changes only the score.
That 0.01 gap is the question the mortgage market is now working through. For three decades FICO was the only score the government-sponsored enterprises accepted. Since July 2025, lenders delivering loans to Fannie Mae and Freddie Mac can choose Classic FICO or VantageScore 4.0, and HUD said in April 2026 that FHA will follow with VantageScore 4.0 and FICO 10T. In March 2026 the three bureaus cut the standalone mortgage price of VantageScore 4.0 to about a dollar a score, against FICO's $10 for 2026. Rocket Mortgage announced on September 28 that VantageScore 4.0 becomes its default model on eligible agency and VA loans in the fourth quarter.
Each of those decisions depends on one empirical claim: that VantageScore sorts good borrowers from bad ones about as well as FICO does. Bureau and vendor studies make that case. This post tests it on public loan-level data, using the only US auto ABS collateral that discloses both scores side by side.
The same borrowers under two scores
Carvana's 2026 securitizations (CRVNA 2026-P1, P2 and P3) file the obligor credit score as a pair, VS 801, FICO 736, on more than 99% of each pool. I covered when that started and how the two scales map onto each other in VantageScore vs FICO: Loan-Level Evidence From Auto ABS. With eight months of monthly performance now on file, the data supports a performance comparison.
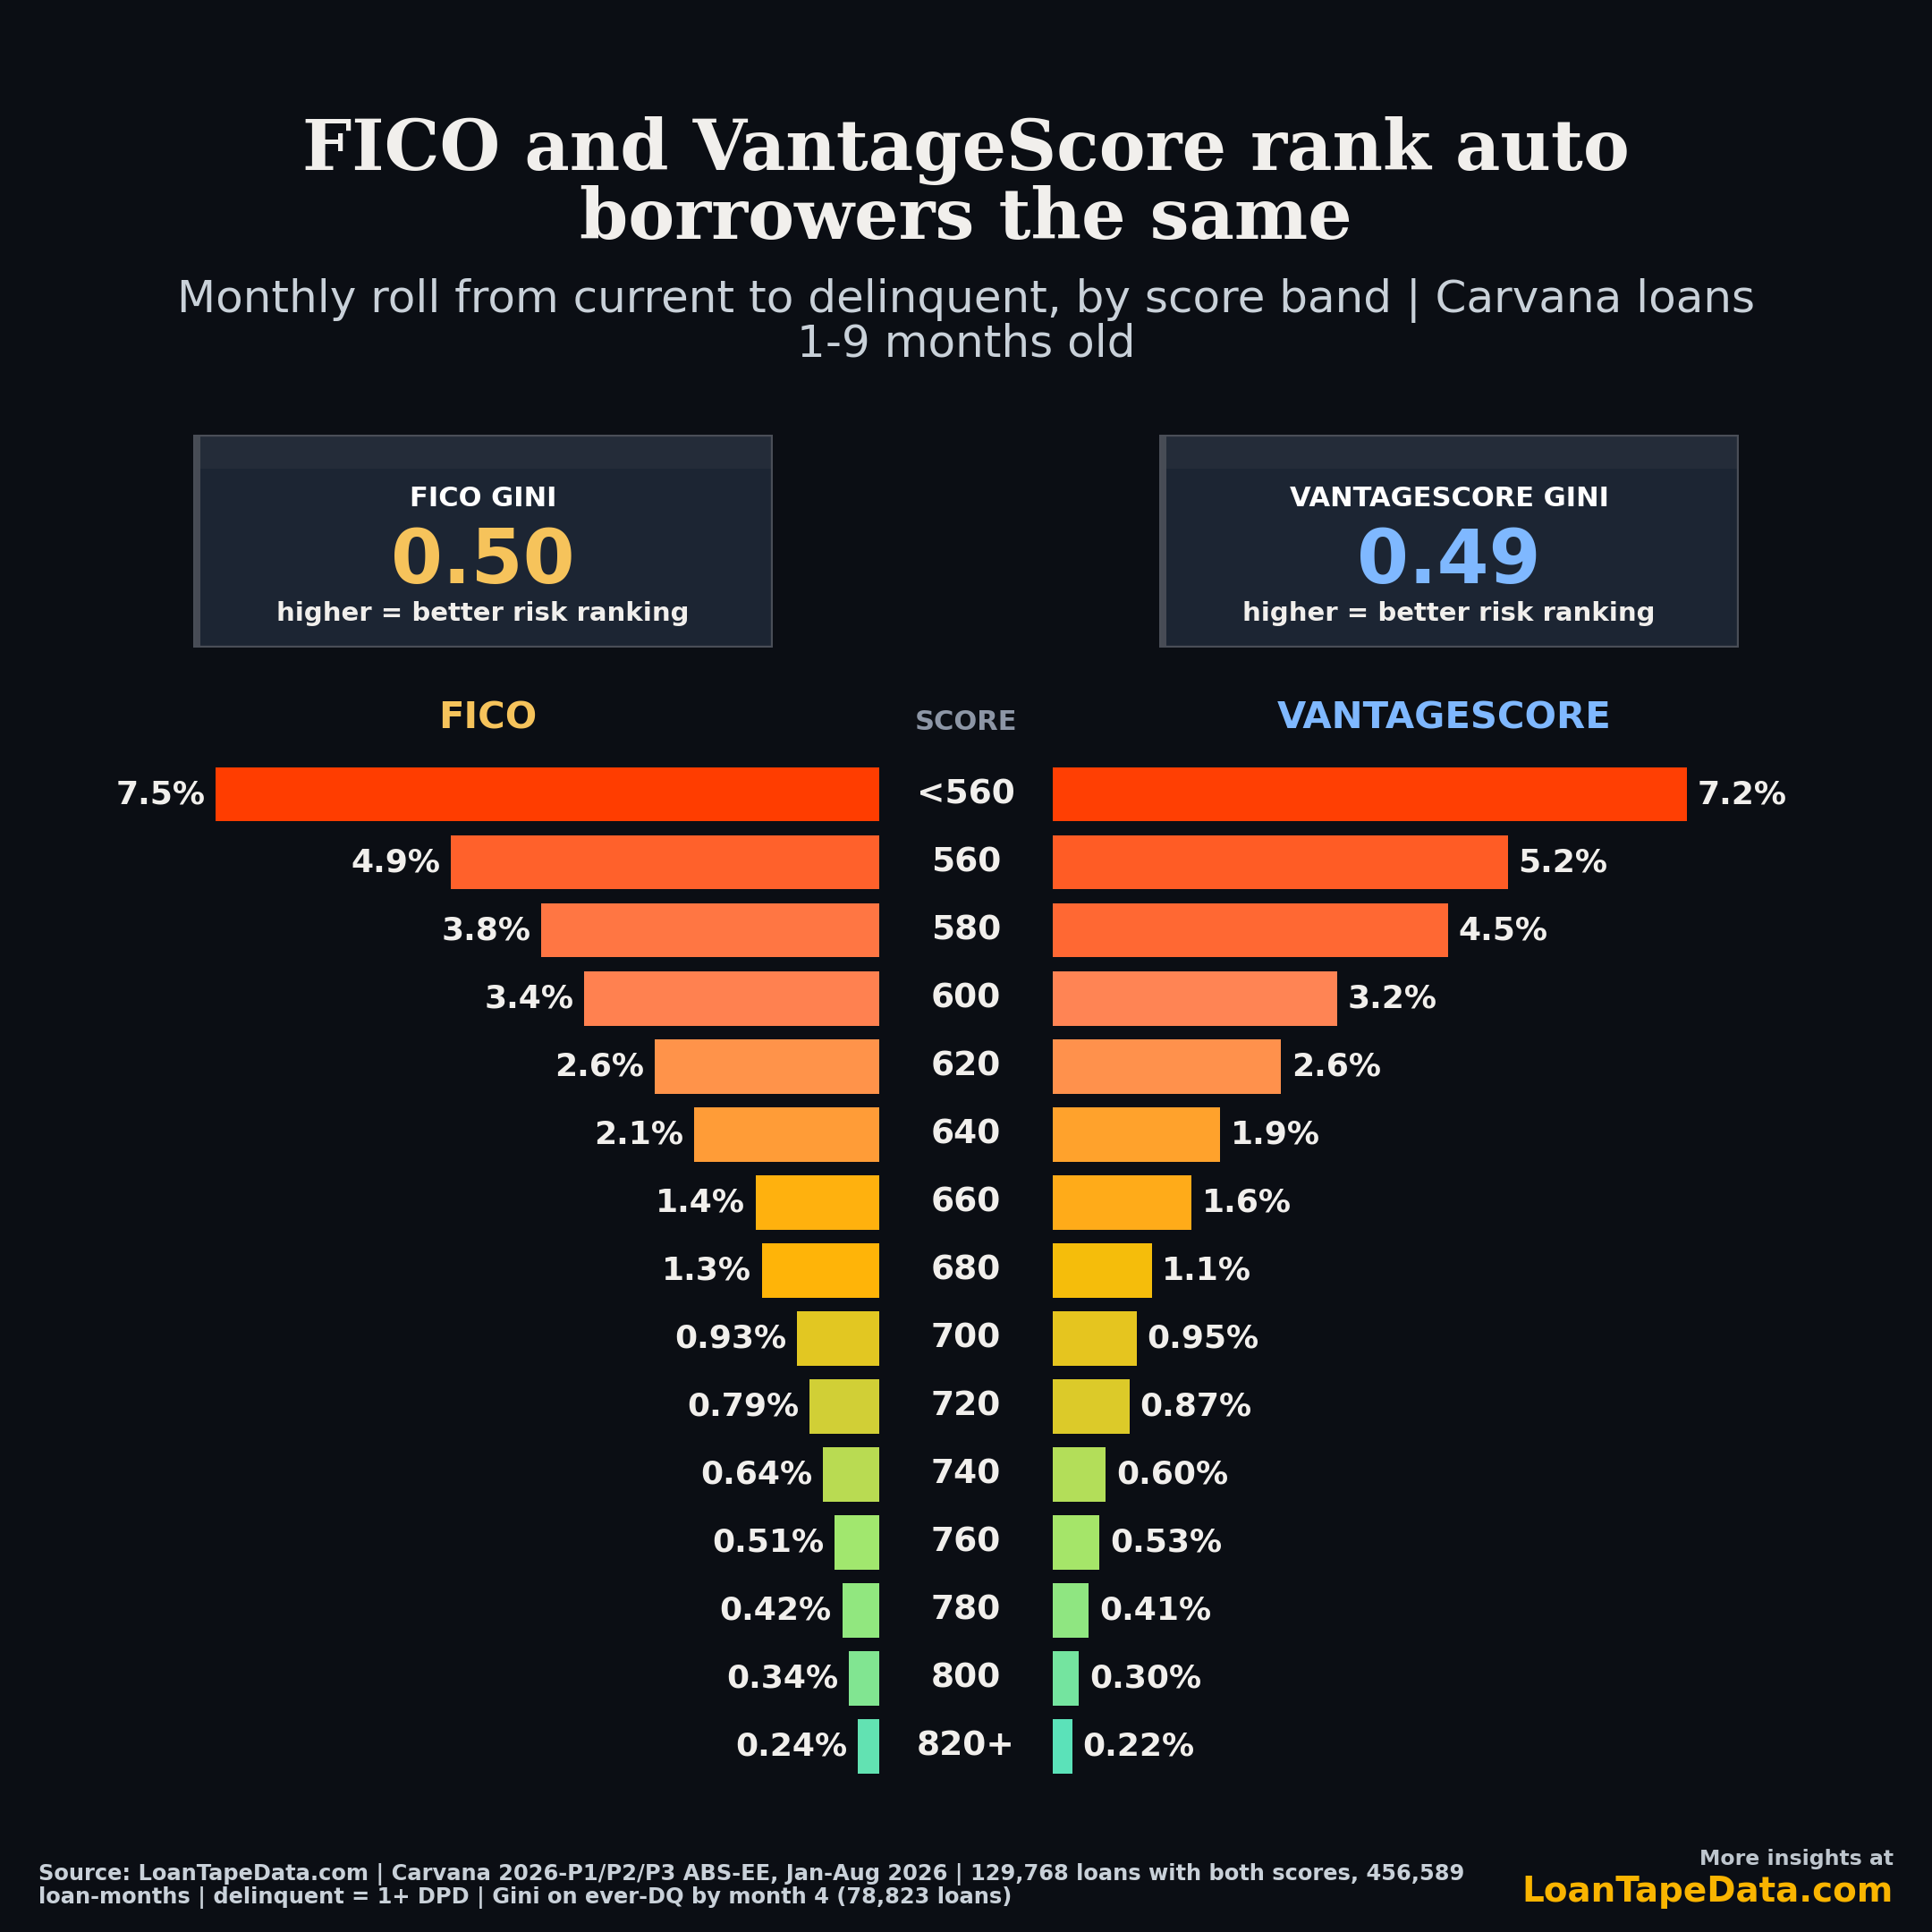
The chart bands every loan twice: once by its FICO and once by its VantageScore, in 20-point bands on each score's own scale. Each bar is the monthly roll rate: the share of loans that were current one month and delinquent (1+ days past due, DPD) the next.
| Score band | FICO roll rate | VantageScore roll rate |
|---|---|---|
| Below 560 | 7.5% | 7.2% |
| 560-579 | 4.9% | 5.2% |
| 600-619 | 3.4% | 3.2% |
| 660-679 | 1.4% | 1.6% |
| 700-719 | 0.93% | 0.95% |
| 760-779 | 0.51% | 0.53% |
| 820+ | 0.24% | 0.22% |
The two funnels are close to mirror images. Under either score, a borrower below 560 rolls to delinquency about 30 times as often as one at 820 or above. Adjacent bands trade places by a few tenths of a point (FICO's 680 band runs worse than VantageScore's, VantageScore's 580 band worse than FICO's), but neither score is consistently higher or lower across the range.
Measuring the gap
Band charts show the shape. The Gini coefficient condenses rank-ordering into one number: 0 is a coin flip, 1 is perfect separation. Because each loan carries both scores, I can compute the difference between the two Ginis on identical loans and bootstrap a confidence interval around it, resampling whole loans so a borrower's repeated months are not counted as independent observations.
| Test | FICO Gini | VantageScore Gini | Difference (VS minus FICO) |
|---|---|---|---|
| Ever delinquent by month 4 | 0.500 | 0.486 | -0.014 |
| 1-month roll, current to delinquent | 0.503 | 0.493 | -0.010 |
| 3-month roll, current to delinquent | 0.506 | 0.494 | -0.012 |
| CRVNA 2026-P1 only | 0.508 | 0.499 | -0.009 |
| CRVNA 2026-P3 only | 0.525 | 0.524 | -0.001 |
FICO comes out ahead in every whole-pool test, and with this many loans the edge is statistically distinguishable from zero. It is also small. I set an equivalence margin of 0.03 Gini, a gap below which most credit teams would not change a scorecard, and the 90% confidence interval sits inside that margin in seven of the eight whole-pool tests. The eighth, ever 30+ DPD by month 6, has only 341 delinquent loans so far and an interval too wide to call either way.
A second check asks whether one score adds information on top of the other. Within each 40-point FICO band, splitting loans by VantageScore separates early delinquency by 1.39 times. Within each VantageScore band, splitting by FICO separates it by 1.71 times. A model using both scores reaches a Gini of 0.506, against 0.500 for FICO alone. The two scores carry mostly the same information, and FICO holds slightly more of what is unique.
Where FICO's edge exists, it is in subprime. Among loans whose average of the two scores is below 660, FICO's Gini is 0.28 and VantageScore's is 0.24, a gap outside the 0.03 margin. Above 740 the point estimate favors VantageScore, but the interval is wide and I would not read a direction into it.
What this does and does not show
This is auto, not mortgage, and it is one lender. Carvana underwrites to its own criteria, and if one of these scores fed the approval decision, the approved pool is truncated along that score, which can tilt a comparison toward the other. The filings do not say which score versions these are, or which bureau and pull date each came from, so differences in data vintage cannot be ruled out.
The loans are also young. Monthly observations run from one to nine months on book, with a median of three. Early delinquency is where rank-ordering shows up first, but it is not loss. The comparison that would settle the question is Gini on charge-offs and 60+ DPD through a full credit cycle, and this collateral is at least a year from supporting it.
Within those limits, the result is narrow and consistent: on the same borrowers, the two scores rank early delinquency risk within about 0.01 Gini of each other, FICO slightly ahead, with the difference concentrated below 660. If that holds as the loans season, the mortgage debate shifts from which score ranks risk better to what a 0.01 Gini difference is worth against a roughly $9 price difference per score. FICO's case rests on decades of validation through multiple credit cycles, which eight months of auto data cannot match.
I will rerun this as the 2026 Carvana pools age and new dual-scored deals file. The loan-level fields behind it, including both scores and the monthly delinquency status, are in our ABS-EE loan-level data, with servicer-level reconciliation in the Form 10-D data. Access details are on the pricing page.
Methodology
- Universe: 129,768 loans in CRVNA 2026-P1, 2026-P2 and 2026-P3 whose
obligorCreditScorefield carries both a VantageScore and a FICO score, from ABS-EE filings for the January through August 2026 collection periods. - Roll rates: a loan-month counts if the loan was current (0 DPD) and the following calendar month is reported. Payoffs, final reported months and reporting gaps drop out of the denominator rather than counting as non-delinquent. 456,589 loan-months qualify.
- Delinquent: 1+ DPD.
- Gini: 2 × AUC − 1, with higher scores treated as lower risk. The headline figure uses ever 1+ DPD by month 4 on the 78,823 loans observed through month 4, a fixed window so older loans do not get extra time to go delinquent.
- Confidence intervals: 300 bootstrap resamples of whole loans. Equivalence means the 90% interval for the Gini difference lies within ±0.03.
- Bands: each loan is banded separately on each score's own scale, so the FICO 600 bar and the VantageScore 600 bar contain overlapping but different sets of borrowers.