May Auto ABS Nowcast: Prime Moves Too Far
Prime 30+ DQ is nowcasting up 21 bps for May. That is the largest month-over-month prime increase in the LoanTapeData FICO-segment history back to 2017.
That is not the number I expected to care about this week. Subprime still has the higher delinquency rate, as usual. But the May nowcast is more interesting because prime is moving in a way that does not look normal for the segment.
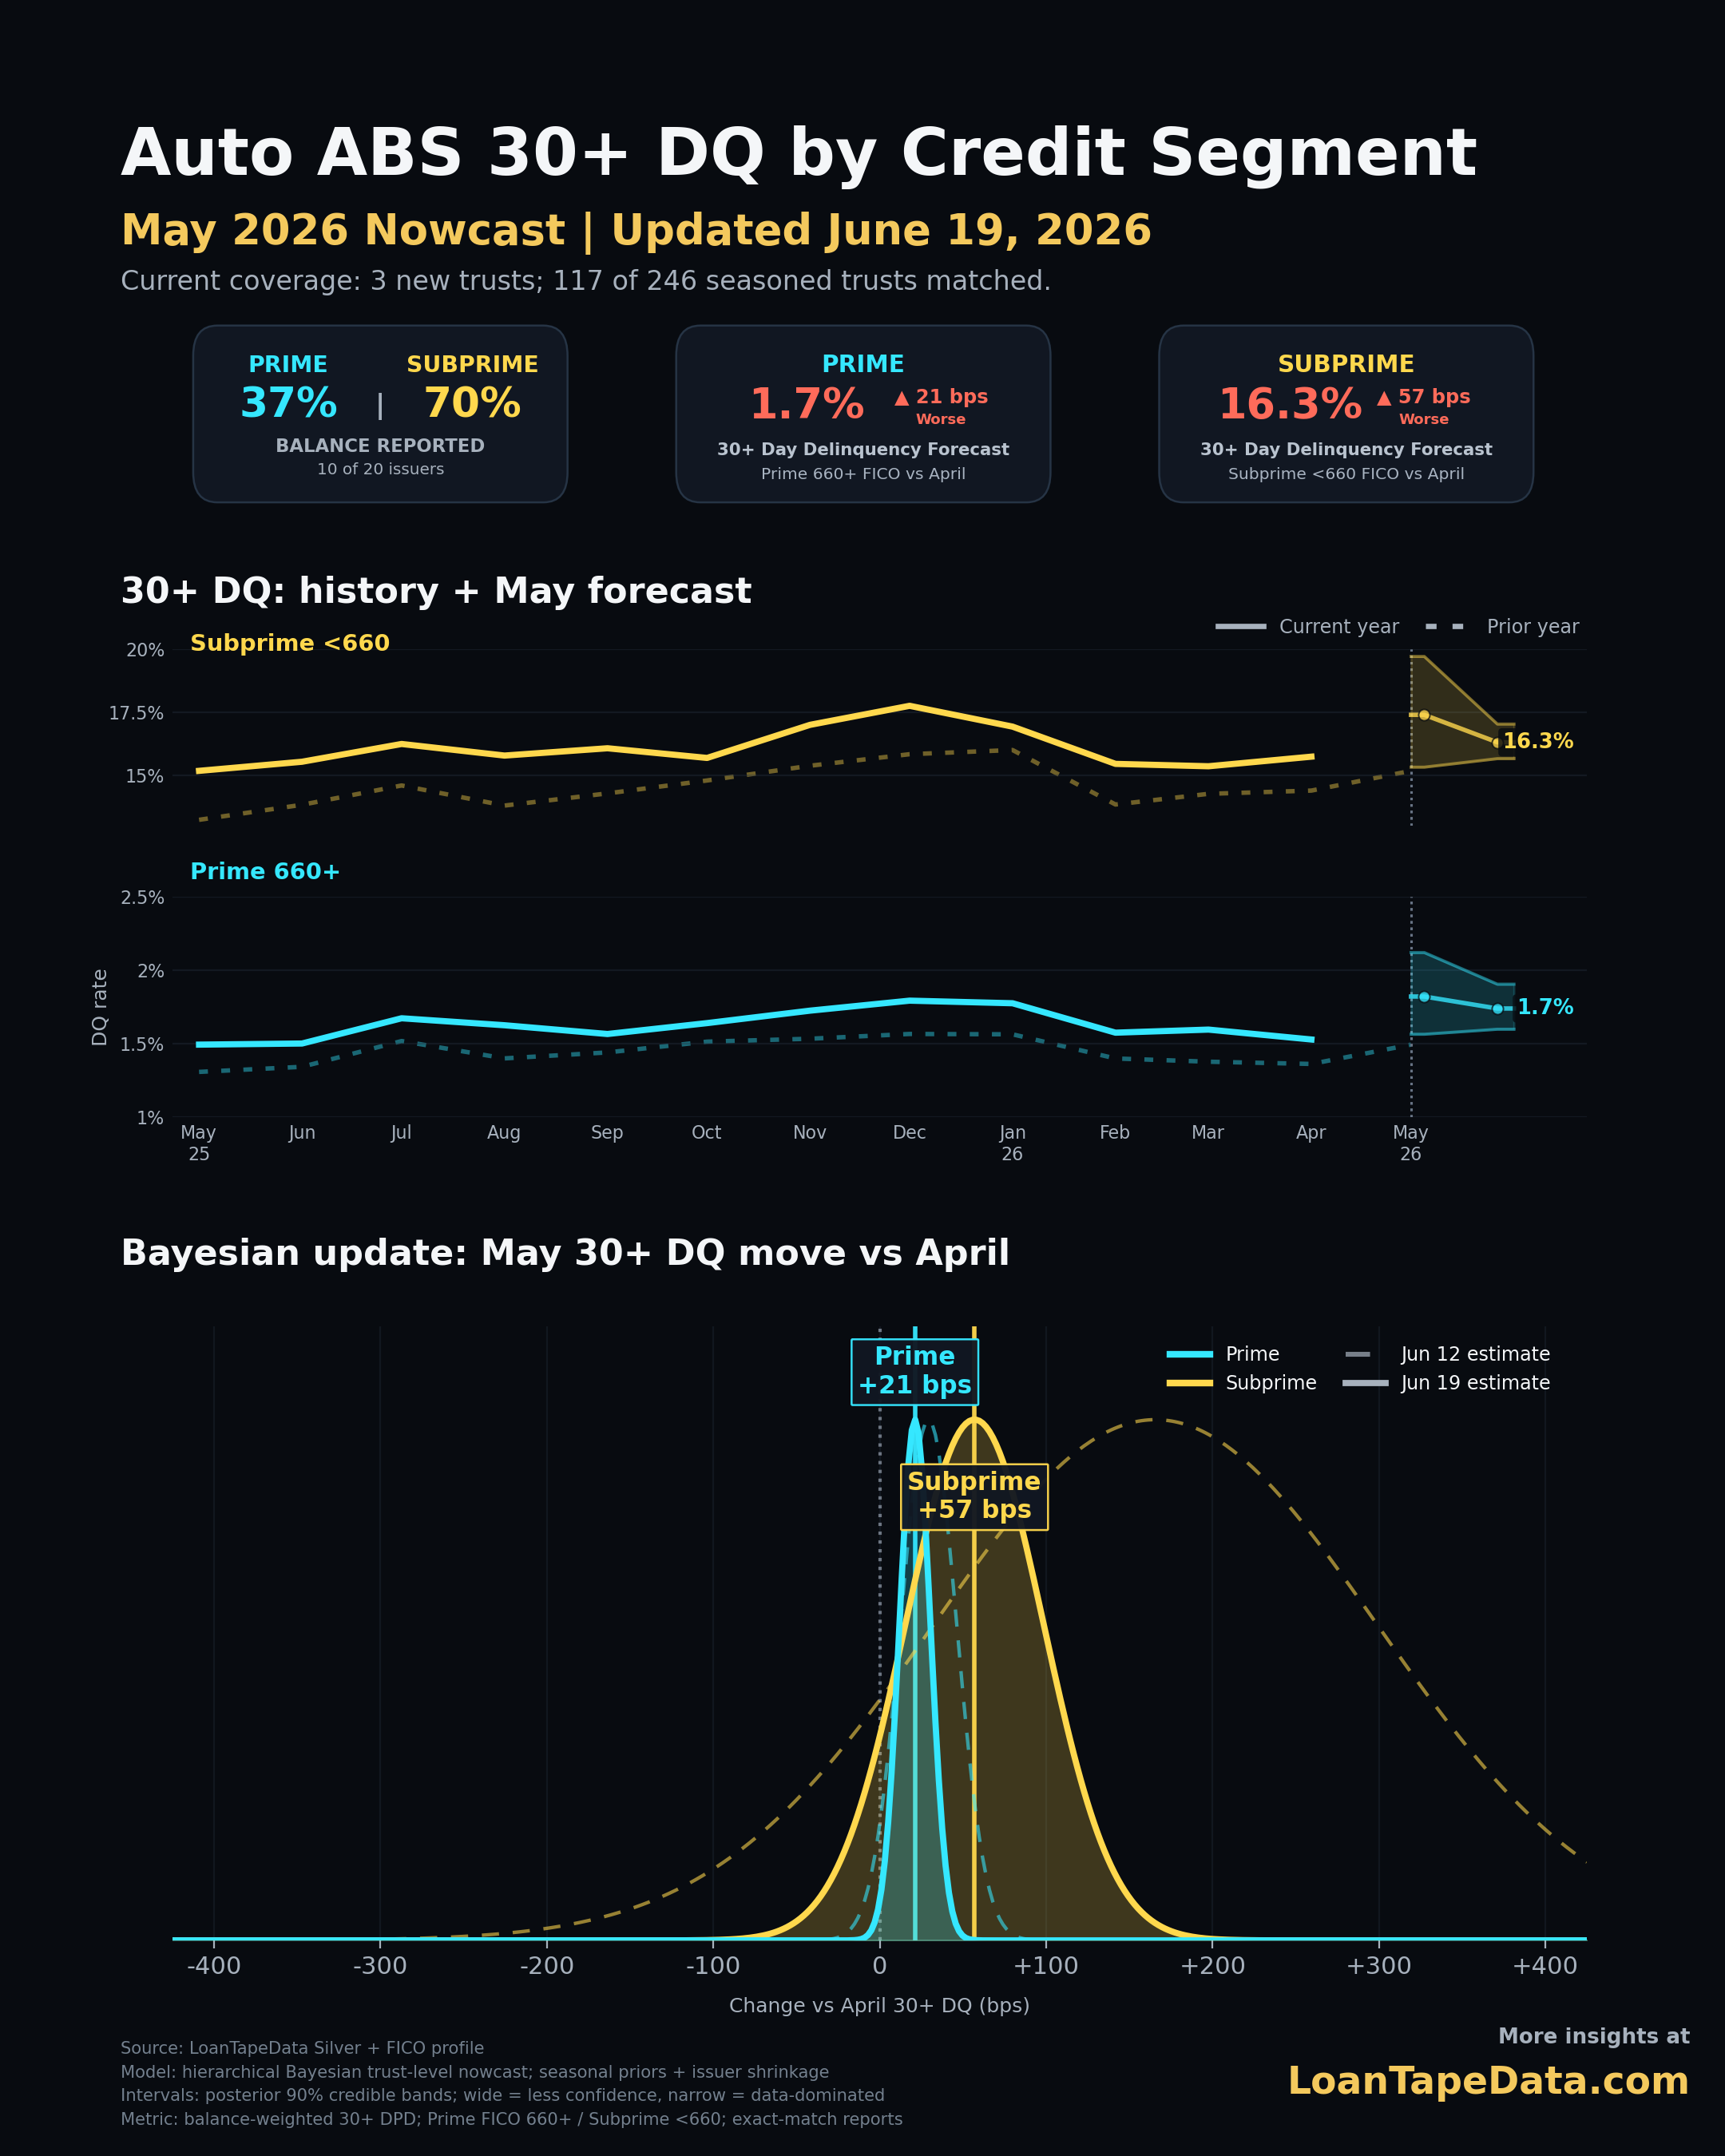
At the FICO-segment surface, May 2026 is nowcasting at 1.74% 30+ DQ for prime 660+ borrowers and 16.30% for subprime <660. Current reports cover 46.0% of April baseline balance, with 229 of 473 seasoned issuer/trust/FICO rows matched and six new trust-segment rows included.
The prime move is the unusual part
The prime forecast moved from 1.53% in April to 1.74% in May. That is a 21.2 bp increase.
For subprime, May is nowcasting from 15.74% in April to 16.30%, a 57.0 bp increase. That sounds larger, but the history reads differently. Subprime delinquency often moves around by that much during seasonal turns. Prime usually does not.
| Segment | April 2026 30+ DQ | May 2026 nowcast | 90% interval | Move vs April | Historical M/M percentile |
|---|---|---|---|---|---|
| Prime 660+ | 1.53% | 1.74% | 1.60%-1.90% | +21 bps | 100th |
| Subprime <660 | 15.74% | 16.30% | 15.66%-17.03% | +57 bps | 64th |
The prime move sits above every prior monthly prime increase in the FICO-segment history. The next largest prime increases were July 2024 at +17.6 bps, July 2025 at +17.2 bps, and July 2022 at +16.9 bps.
That does not make May a credit crisis. The absolute prime delinquency rate is still low. But it does mean the clean part of the book is not as quiet as the headline market rate makes it look.
The rank table is useful because it forces the question into scale. A 21 bp move sounds small next to subprime levels, but it is large for prime. The five biggest historical prime monthly increases before this update were all below the current May forecast:
| Month | Prime 30+ DQ | Prior month | M/M move |
|---|---|---|---|
| Jul 2024 | 1.52% | 1.34% | +17.6 bps |
| Jul 2025 | 1.67% | 1.50% | +17.2 bps |
| Jul 2022 | 1.06% | 0.89% | +16.9 bps |
| Oct 2023 | 1.29% | 1.13% | +16.4 bps |
| Oct 2021 | 0.90% | 0.74% | +16.1 bps |
| May 2026 nowcast | 1.74% | 1.53% | +21.2 bps |
That is why I would not describe the May nowcast as simply "subprime still high." Subprime is high. It usually is. The newer information is that prime is producing a move that sits outside its normal monthly range.
The all-market May 30+ DQ nowcast is 5.21%, versus 4.75% in April and 5.51% in May 2025. In other words, the full market is probably up month over month, but still below last May. That is a decent headline. The prime move is the footnote I would not ignore.
Subprime is seasonal, but not extreme
Subprime is still worse in level. A 16.30% 30+ DQ nowcast is not a benign number. It is also not an outlier month-over-month move for subprime.
The May-over-April history explains why.
| Year | Prime May-over-April move | Subprime May-over-April move |
|---|---|---|
| 2021 | +12 bps | +121 bps |
| 2022 | +9 bps | +149 bps |
| 2023 | 0 bps | +99 bps |
| 2024 | +6 bps | 0 bps |
| 2025 | +13 bps | +78 bps |
| 2026 nowcast | +21 bps | +57 bps |
For subprime, the current +57 bp forecast is below the May-over-April median in the history. It ranks in the 33rd percentile among May-over-April subprime moves, and the 64th percentile among all subprime monthly moves.
That is still deterioration. It just is not a historically severe subprime seasonal hit.
Prime is different. The May-over-April prime history had never shown a move larger than +13.2 bps before this nowcast. The current +21.2 bp forecast clears that by a wide margin.
A simple reading would say subprime is the problem because the rate is high. The better surveillance read is that prime is the surprise because the change is unusual.
Why a reported-only read can mislead
Partial filing months are messy.
One new clean trust can report early. An older seasoned trust can report later. A prime-heavy issuer can arrive before a subprime-heavy issuer. Reported-only delinquency can look better or worse because the sample changed, not because borrower behavior changed.
That is why the nowcast matches at the issuer, trust, FICO segment, and reporting-month grain. Current-month rows replace exact prior-month rows only when the same issuer/trust/FICO segment has reported. New trusts are included separately. Missing seasoned rows stay anchored to their April delinquency level, then receive a same-calendar-month seasonal roll-forward with issuer and market shrinkage.
In plainer terms: a new clean trust does not get to stand in for a missing seasoned trust.
That matters in May because the coverage is still partial. The FICO-segment surface has 46.0% raw reported balance coverage against the April baseline. The model is already using a meaningful amount of May data, but the final month-end print is not here yet.
The current visual also shows the balance split: 37% of prime balance and 70% of subprime balance has reported. That imbalance is part of the reason I would be careful with a straight reported-only comparison. The nowcast is trying to answer a narrower question: after controlling for the missing seasoned rows, where does May likely land?
What the full market says
At the full market level, May is not breaking higher versus last year.
The 30+ DQ nowcast is 5.21%. That is up 47 bps from April, but down 30 bps from May 2025. The 90% interval is 4.99% to 5.46%.
The 60+ DQ nowcast is 1.97%, compared with 1.83% in April and 1.99% in May 2025. That is a smaller move: up 14 bps month over month, almost flat versus last year.
| Metric | April 2026 | May 2025 | May 2026 nowcast | Move vs April | Move vs year ago |
|---|---|---|---|---|---|
| 30+ DQ | 4.75% | 5.51% | 5.21% | +47 bps | -30 bps |
| 60+ DQ | 1.83% | 1.99% | 1.97% | +14 bps | -2 bps |
That is the mixed read. The month-over-month move is real, but the year-over-year comparison still looks better. If you only care about the market headline, May is not yet a stress event.
But surveillance is not just about the average. It is about the parts of the average that changed in a way they usually do not.
What to watch next
The next filings should answer two questions.
First, does the prime move hold as the remaining seasoned trusts report? A +21 bp nowcast is a strong early signal, but prime coverage is still behind subprime. If late-reporting prime trusts come in cleaner, the forecast can tighten lower. If they confirm the current pattern, May becomes a more interesting prime surveillance month.
Second, does the 30+ move feed into 60+ DQ over the next month or two? Right now the full-market 60+ nowcast is close to year-ago May. That can happen when early delinquency rises before later-stage buckets move. It can also happen when the 30+ move cures quickly and never becomes a deeper delinquency issue.
The issuer question comes after that. A broad prime move across shelves means something different from a few trusts pulling the whole segment higher. The nowcast already works at issuer/trust/FICO grain, so the next cut is straightforward: which exact seasoned rows are producing the prime move?
That is the part I would want on a surveillance desk. The headline says May 30+ DQ is up. The useful question is whether prime is quietly starting to participate.
Methodology note
This post uses LoanTapeData's recurring Auto ABS DQ nowcast surface. The FICO-segmented visual sources LoanTapeData Silver monthly loan records plus the FICO profile at issuer + trust name + FICO 660 segment + reporting month grain.
The historical month-over-month table uses the same FICO-segment monthly panel. It calculates balance-weighted 30+ DQ by Prime and Subprime segment, then compares each month with the immediately prior month. The current forecast row compares the May 2026 posterior median with the April 2026 actual rate and ranks that move against the historical distribution.
The May 2026 run used 111 historical month-over-month observations per segment and nine same-calendar May-over-April observations per segment. The current forecast rows are included in the generated may_2026_historical_mom_changes.csv output.
That CSV is now part of the recurring nowcast output, so this check does not require a one-off workbook. Each run writes the historical actual rows, the current forecast row, the all-month percentile, and the same-calendar-month percentile. That makes it easier to tell whether a forecast is merely up, or up in a way that is unusual for that segment and month.
This is a filing-season nowcast, not the final May print. Current-month rows replace only exact issuer/trust/FICO-segment matches. New trusts are added separately. Missing seasoned rows are forecast from their own April level with same-calendar-month seasonal movement, issuer shrinkage, and market shrinkage.
The same infrastructure powers LoanTapeData's ABS-EE dataset, Form 10-D data, and ABS remittance data. For issuer, trust, and borrower-segment cuts beyond the public chart, see LoanTapeData pricing.