Subprime Auto Extensions Are Rising Fastest at High LTV
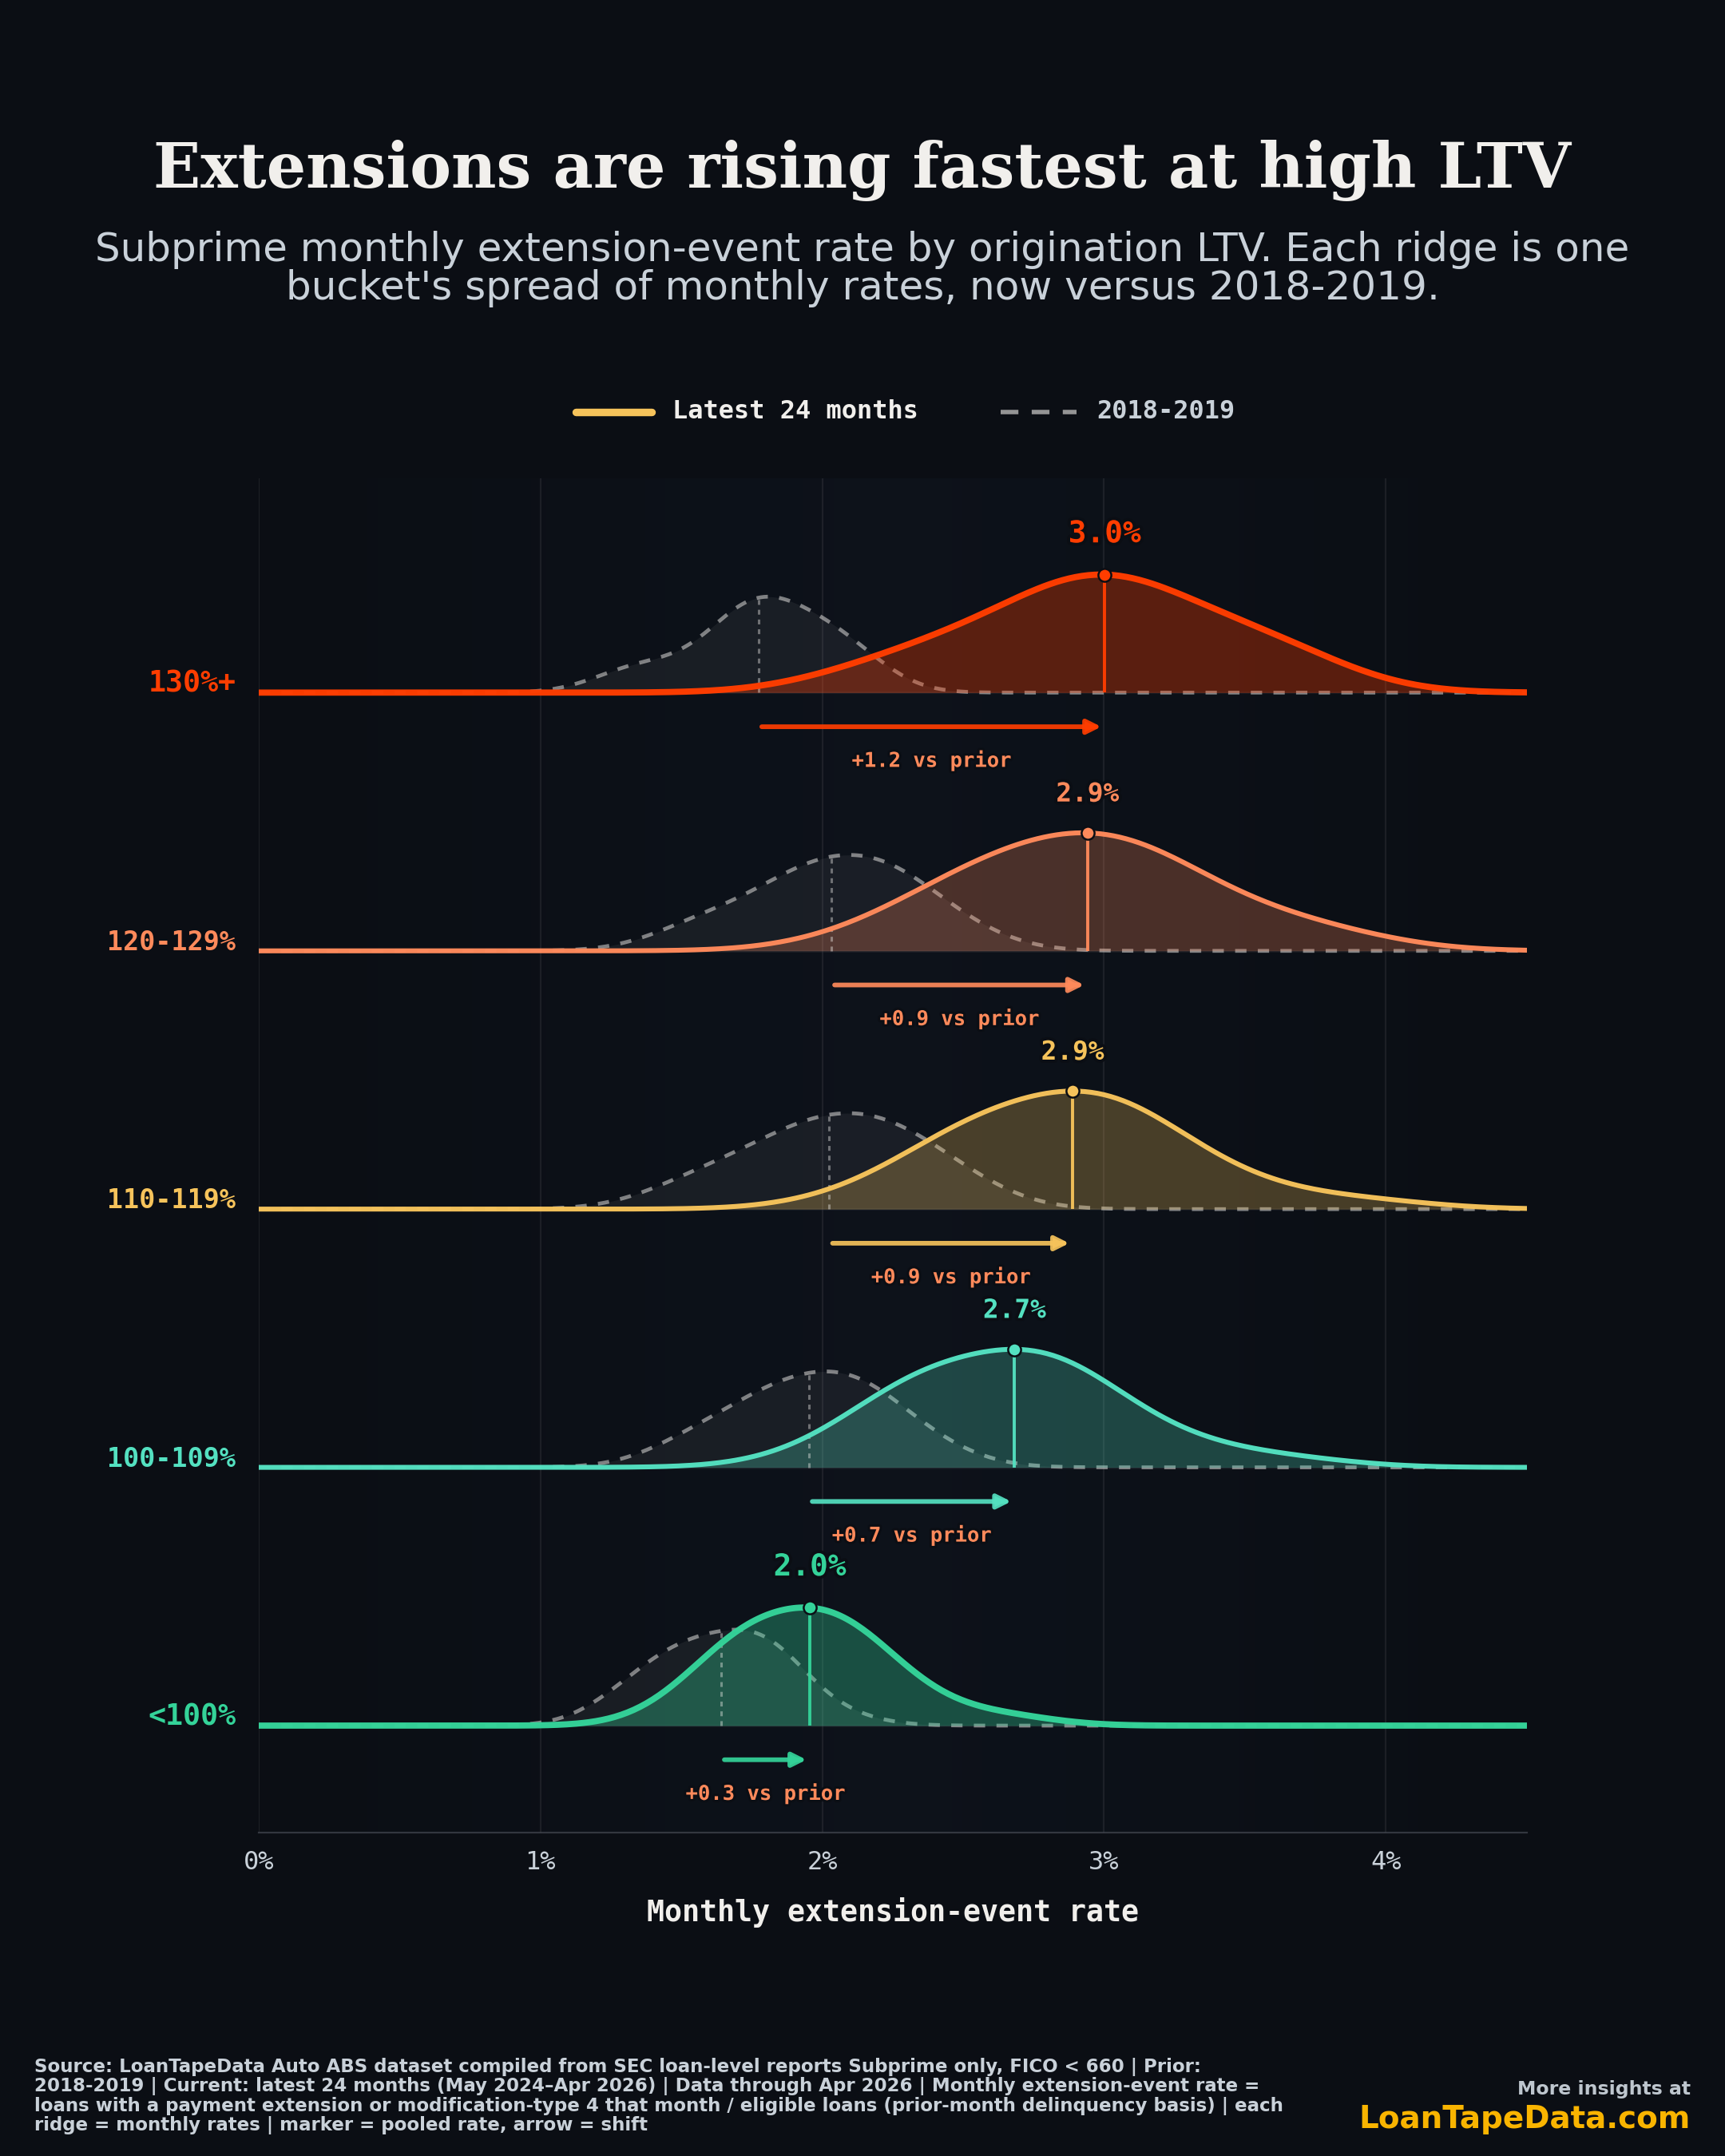
In the subprime auto ABS book, the most underwater borrowers now get a payment extension in about 3.0% of months. Before the pandemic that number was 1.8%. The borrowers with the most equity barely moved: 1.6% then, 2.0% now.
Same pool, same metric, very different slope. The extension rate has tilted toward high loan-to-value loans, and the tilt is new.
Every LTV bucket is extending more
We split the subprime book (FICO under 660) by origination LTV and measured the monthly extension-event rate in each bucket: the share of eligible loans that get a payment extension or a type-4 modification in a given month. Then we compared two windows, the 2018-2019 pre-pandemic average and the latest 24 months through April 2026.
Every bucket is higher now.
| Origination LTV | 2018-19 | Latest 24mo | Change |
|---|---|---|---|
| Under 100% | 1.6% | 2.0% | +0.3 |
| 100-109% | 2.0% | 2.7% | +0.7 |
| 110-119% | 2.0% | 2.9% | +0.9 |
| 120-129% | 2.0% | 2.9% | +0.9 |
| 130% and up | 1.8% | 3.0% | +1.2 |
That is the easy part of the story, and it lines up with what the broader data already shows. The harder part is the shape of the increase.
The LTV gradient is the new part
In 2018-2019, LTV barely sorted extensions. The five buckets sat between 1.6% and 2.0%, a spread of less than half a point, and the highest-LTV group was not even at the top. Loans at 130% and up extended at 1.8% a month, below the 110-129% buckets. If you only had the pre-pandemic tape, you would not say high LTV predicted extensions.
That has changed. The latest 24 months sort cleanly. The rate climbs with every LTV step, from 2.0% under 100% to 3.0% at 130% and up. The spread widened from under half a point to a full point. High LTV went from the middle of the pack to the top of the table.
So there are two things happening at once. The level is up everywhere, and a gradient appeared where there was almost none. Extensions used to be roughly flat across the LTV range. Now they read like a risk curve.
The move is concentrated at the top
The increase is not even. The 130%-and-up bucket rose 1.2 points. The under-100% bucket rose 0.3. That is close to four times the move at the top of the LTV range versus the bottom.
Another way to see it: in 2018-2019, the highest- and lowest-LTV subprime borrowers extended at almost the same rate, a gap of about a tenth of a point. Today that gap is about a full point. The distance between the most and least underwater borrowers went from nothing to the widest spread on the chart.
Why LTV is the cut that matters here
LTV is not just another borrower attribute. It is the recovery lever. A subprime borrower at 130% LTV has negative equity from day one. If that loan charges off, the collateral covers less of the balance, so loss severity is higher. A borrower under 100% LTV has a cushion.
So the loans where extensions are climbing fastest are the same loans where a default costs the most. That is the part worth sitting with. An extension moves payment timing. It does not change the collateral. If the highest-severity loans are the ones getting the most timing relief, the pool can look calmer on a delinquency chart while the underlying recovery math has not improved.
This fits the rest of the extension picture. Subprime extensions are running well above their 2018-2019 average, and they need to be read by segment instead of as one aggregate rate. The LTV cut is the next layer down. It says the elevated usage is not spread evenly. It is heaviest exactly where the equity is thinnest, which is also where the 2021-and-later collateral break left the most loans upside down.
The depth signal points the same way
The monthly rate is one lens. The other one we track is how much of the book has had payment timing moved over a trailing year, and it has been climbing too. In April 2026, 23.1% of eligible subprime loans had at least one moved payment month in the prior twelve, up from a 14.9% average in 2018-2019. The deeper bucket matters more: subprime loans with three or more moved months in a year ran at 5.1% in April, against 1.6% before the pandemic. We walked through that read in extensions are a credit signal again.
Those trailing-year numbers are not split by LTV. But they point the same direction as the monthly cut. Subprime extension usage is both broader and deeper than it was, and the LTV gradient says the broadening is not even. One lens says more of the book is being touched. The other says the touch is heaviest in the 130%-and-up loans, the same loans with the least equity and the highest loss if they go.
Good servicing or deferred loss
There are two readings, and both are real.
The benign one: a servicer gives a stretched borrower one month, the borrower recovers, and the extension did its job. High-LTV borrowers tend to run tighter on cash, so it is not strange that they ask for relief more often.
The other one: extensions on deeply underwater loans push the recognition of a loss further out without changing the odds it eventually lands. The borrower still has to perform. The collateral still does not cover the balance. The pool reports cleaner this quarter, and the question moves to next quarter.
You cannot tell which reading is right from the extension rate alone. You need the outcome. After a high-LTV borrower gets an extension, do they cure, or do they roll to 30-plus DPD and charge off anyway? And do they do it at a different rate than a low-LTV borrower who got the same treatment from the same starting delinquency bucket?
What I'd watch next
Two things.
First, post-extension outcomes by LTV. Take subprime borrowers who got an extension from the same starting delinquency bucket, then measure how many are 30-plus DPD or charged off a couple of months later, split by LTV. If high-LTV extensions cure at the same rate as low-LTV ones, the timing relief is doing real work. If they re-default more often, the extension was mostly deferral. That is the test, and it is the analysis I am building next.
Second, issuer behavior with borrower mix controlled. The pool blends a lot of different originators. A subprime-heavy lender will always show more extensions than a prime-heavy one, so the level alone tells you little. The better question is whether a given issuer is extending more than its own book would predict. One name worth that test is Carvana and its servicing arm Bridgecrest, a large ABS participant that also leans on credit facilities to fund originations and inventory. Is its extension rate tracking the subprime pool, or running above what its own borrower mix predicts? The market tends to price that distinction, and it is the next cut I want to run.
Methodology
The extension metric here is the monthly extension-event rate: loans with a positive normalized payment_extended_number or an SEC modification_type_code of 4 or 04 in a given month, divided by eligible loans on a prior-month delinquency basis. Eligible loans are active, non-terminal reported loans with balance above $1 and the required prior-DPD and FICO fields. Subprime is FICO under 660. LTV is origination loan-to-value.
The two comparison windows are the 2018-2019 average and the latest 24 months, May 2024 through April 2026. COVID relief-period behavior is not used as the baseline. Rates are pooled within each window, so each bucket's number is that window's total extension events over its total eligible loans.
This runs on the same loan-level infrastructure behind LoanTape's ABS-EE dataset, Form 10-D data, and ABS remittance data. The subscriber version, with issuer, trust, and post-extension outcome cuts, is in the Modification Effectiveness Deep Dive. For the loan-level files behind it, see LoanTape pricing.