Auto Extensions Are a Credit Signal Again
Auto loan extensions are easy to skip past. They sit in the servicing data, they sound procedural, and they do not carry the same weight as delinquency or losses.
I think that is the wrong read.
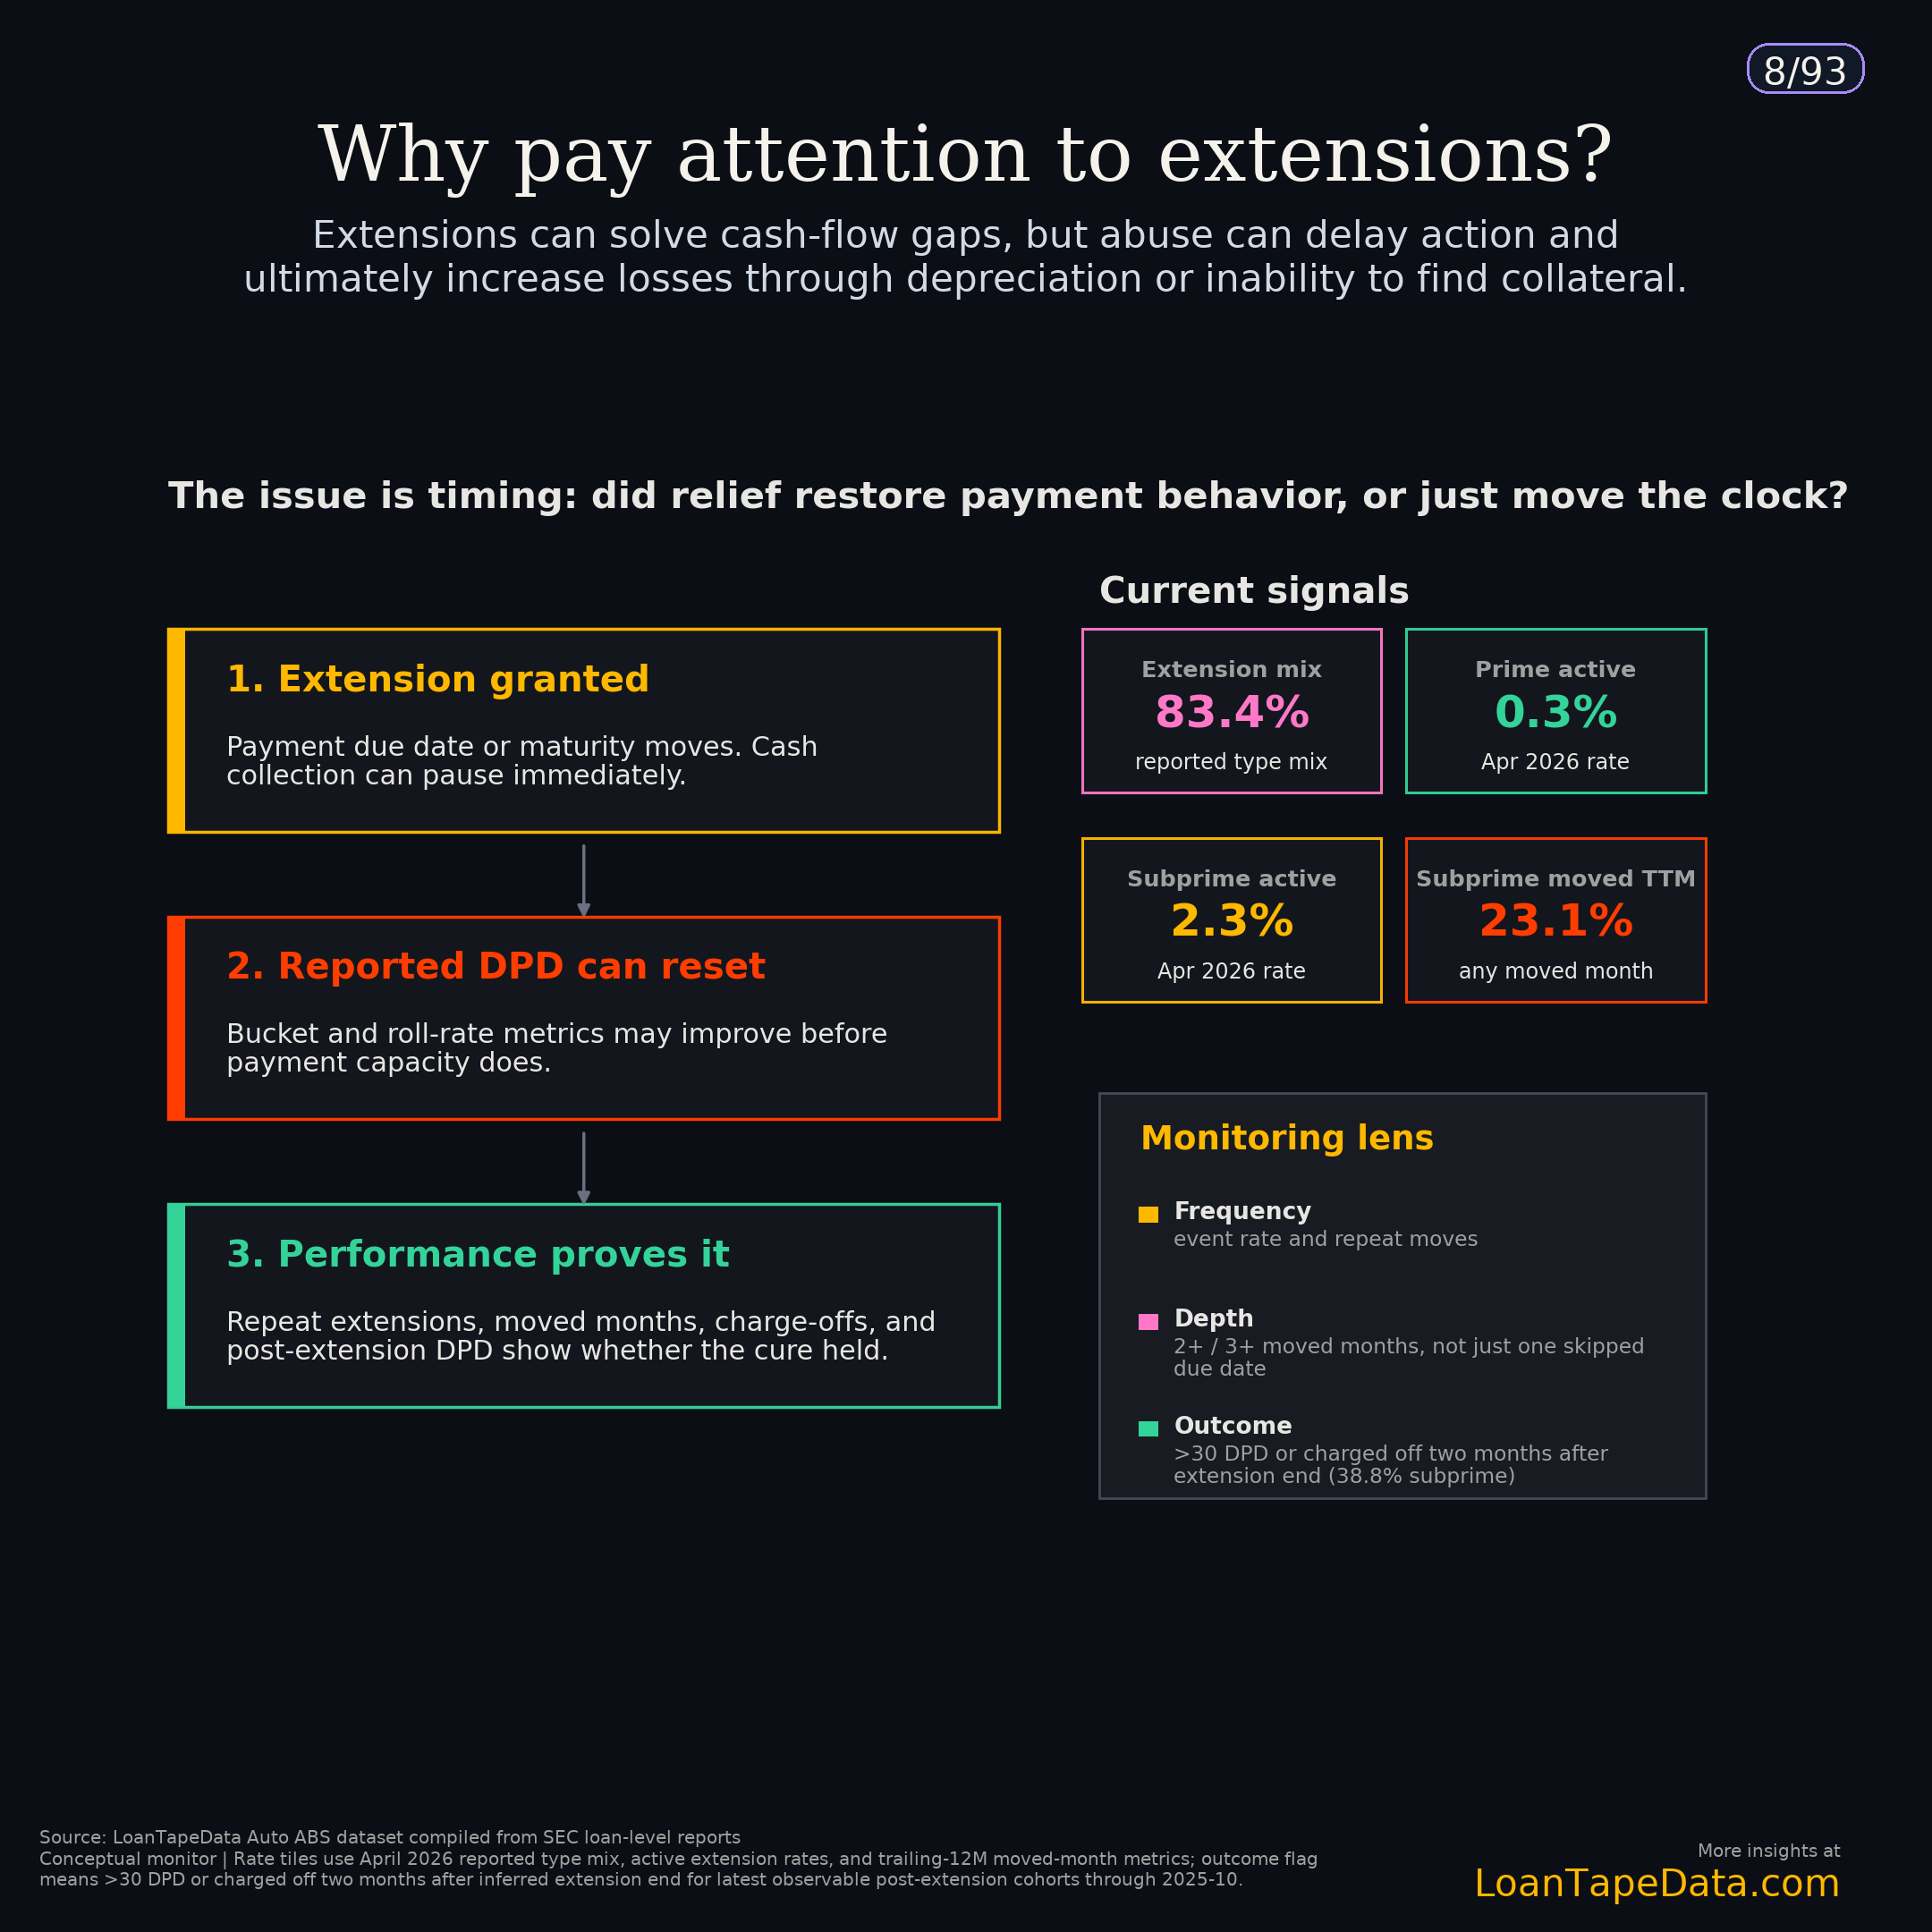
In the April 2026 Auto ABS loan-level data, extensions were 83.4% of reported modifications: 67,549 extension-type modifications out of 80,974 reported modifications in the display total. So when we talk about modifications in this dataset, we are mostly talking about extensions.
That does not make every extension suspicious. A borrower can hit a temporary cash problem, get an extension, and recover. That is the clean version of the story, and it happens.
The problem is that extensions can also make a pool look cleaner for a while than it really is. They move payment timing. The borrower still has to perform after that.
April's drop was a mix shift
The broad all-outstanding moved-month rate fell from 8.59% in March to 7.88% in April. That sounds like improvement until you split the book.
April had a slightly larger prime share and a slightly smaller subprime share. That matters because prime loans have much lower extension rates. In the eligible-loan panel, prime moved from 69.5% of the March book to 69.8% in April. Subprime fell from 30.5% to 30.2%.
Inside each segment, usage still rose. Prime trailing-12-month any-moved usage went from 3.38% in March to 3.41% in April. Subprime went from 22.82% to 23.10%. The 3+ moved-month rate also rose in both segments.
So the aggregate rate came down because the book changed. The prime and subprime extension rates did not ease.
Still well above 2018-2019
Even after the April step-down, extension usage is still running above the pre-pandemic baseline.
As of April 2026, 696,637 Auto ABS loans had at least one payment month moved in the trailing 12 months. That was 7.88% of all outstanding loans in the panel. The 2018-2019 average was 5.16%.
So April was still about 53% higher than the 2018-2019 average.
That is the point I would keep in mind. April was lower than March, but it was not normal. It was a lower aggregate print with segment rates still grinding higher.
The active extension field is too small a lens
In April 2026, the active extension rate was 0.93% of eligible loans. That is the current-month view.
The trailing-12-month moved-month rate was 9.36%. That is the recent-history view: loans in the current eligible book that had at least one payment month moved during the prior year.
Those two numbers are supposed to be different. A loan can stop showing as actively extended and still have had payment timing moved recently.
For surveillance, I care more about the trailing-12-month measure. The active field tells you what happened this month. The moved-month measure tells you how much of the book has already had payment timing adjusted.
Subprime depth is the better warning light
The subprime numbers are where this starts to get uncomfortable.
| Metric | April 2026 | 2018-2019 avg |
|---|---|---|
| All outstanding loans with any moved month | 7.88% | 5.16% |
| Eligible loans with any moved month | 9.36% | 5.78% |
| Prime eligible loans with any moved month | 3.41% | 1.96% |
| Subprime eligible loans with any moved month | 23.10% | 14.94% |
| Subprime eligible loans with 3+ moved months | 5.13% | 1.59% |
Subprime any-moved usage was 23.10% in April. That is already high.
But the deeper bucket matters more. Subprime loans with 3+ moved months were 5.13% of eligible loans in April, versus 1.59% in 2018-2019.
A one-month extension can be routine. A borrower with 3+ moved months in a year is a different surveillance question. That is more payment timing movement, not just more borrowers touching the extension field once.
Extensions can be good servicing and bad surveillance
This is the part that gets easy to overstate.
Extensions are not automatically loss masking. Sometimes they are exactly what a servicer should do. If a borrower needs one month of relief and then starts paying again, that is a good outcome.
But if extension use stays high, deepens, or concentrates in already-delinquent buckets, delinquency alone is a thin read. You need to know whether payment timing is being moved before the next borrower state shows up in the tape.
The cleanest monitor is simple: active extensions, trailing-12-month moved months, 2+ and 3+ moved-month depth, starting DPD, and post-extension outcomes. I would not flatten those into one extension rate.
A current borrower getting one extension is not the same as a 60-89 DPD borrower getting another extension after prior payment timing movement. The aggregate rate hides that difference.
Read extensions beside delinquency
Delinquency is still the main credit metric. I am not arguing otherwise.
But extension data answers a different question: how much payment timing has already moved?
If delinquency is flat and moved-month usage is rising, the pool is not as clean as the delinquency chart makes it look. If delinquency and moved-month depth are rising together, the extension data helps explain how borrower stress is being managed.
That is why the subprime 3+ moved-month rate is worth watching. It is small enough to miss in a broad deck, but it captures the deeper part of the extension story.
April did not give us a clean easing signal. The headline rate fell. The segment rates rose. That is exactly the kind of mixed read that makes the extension data useful.
What I would watch next
First, split every aggregate print by prime and subprime. If the aggregate moved-month rate falls again, I would check mix before calling it improvement.
Second, watch subprime 3+ moved months. If that holds near 5.13% or moves higher, the story is still about depth.
Third, look at issuer and trust behavior with borrower mix controlled. A subprime-heavy issuer should not be compared blindly with a prime-heavy issuer. The better question is whether an issuer is using extensions more heavily than its own history would predict for the loans it has.
That is where this gets useful. Extensions are not just a yes/no modification flag. They are a way to see how much payment stress is being handled through timing.
Methodology note
This post uses the April 2026 Auto ABS modification-effectiveness monitor built from SEC-filed loan-level servicer reports. The extension definition is a positive normalized payment_extended_number value or SEC modification_type_code 4/04.
The all-outstanding moved-month measure divides loans with at least one moved payment month in the trailing 12 months by all outstanding Auto ABS loans in the panel. The eligible-loan measures use active, non-terminal reported loans with balance above $1 and required prior-DPD/FICO fields.
The 2018-2019 average is used as the pre-pandemic comparison period. COVID relief-period behavior is not used as the normal baseline.
The same loan-level infrastructure powers LoanTape's ABS-EE dataset, Form 10-D data, and ABS remittance data. The full subscriber deck is available in the Modification Effectiveness Deep Dive. For issuer, trust, and borrower-bucket extension cuts, see LoanTape pricing.