Subprime Auto's 2021 Collateral Break
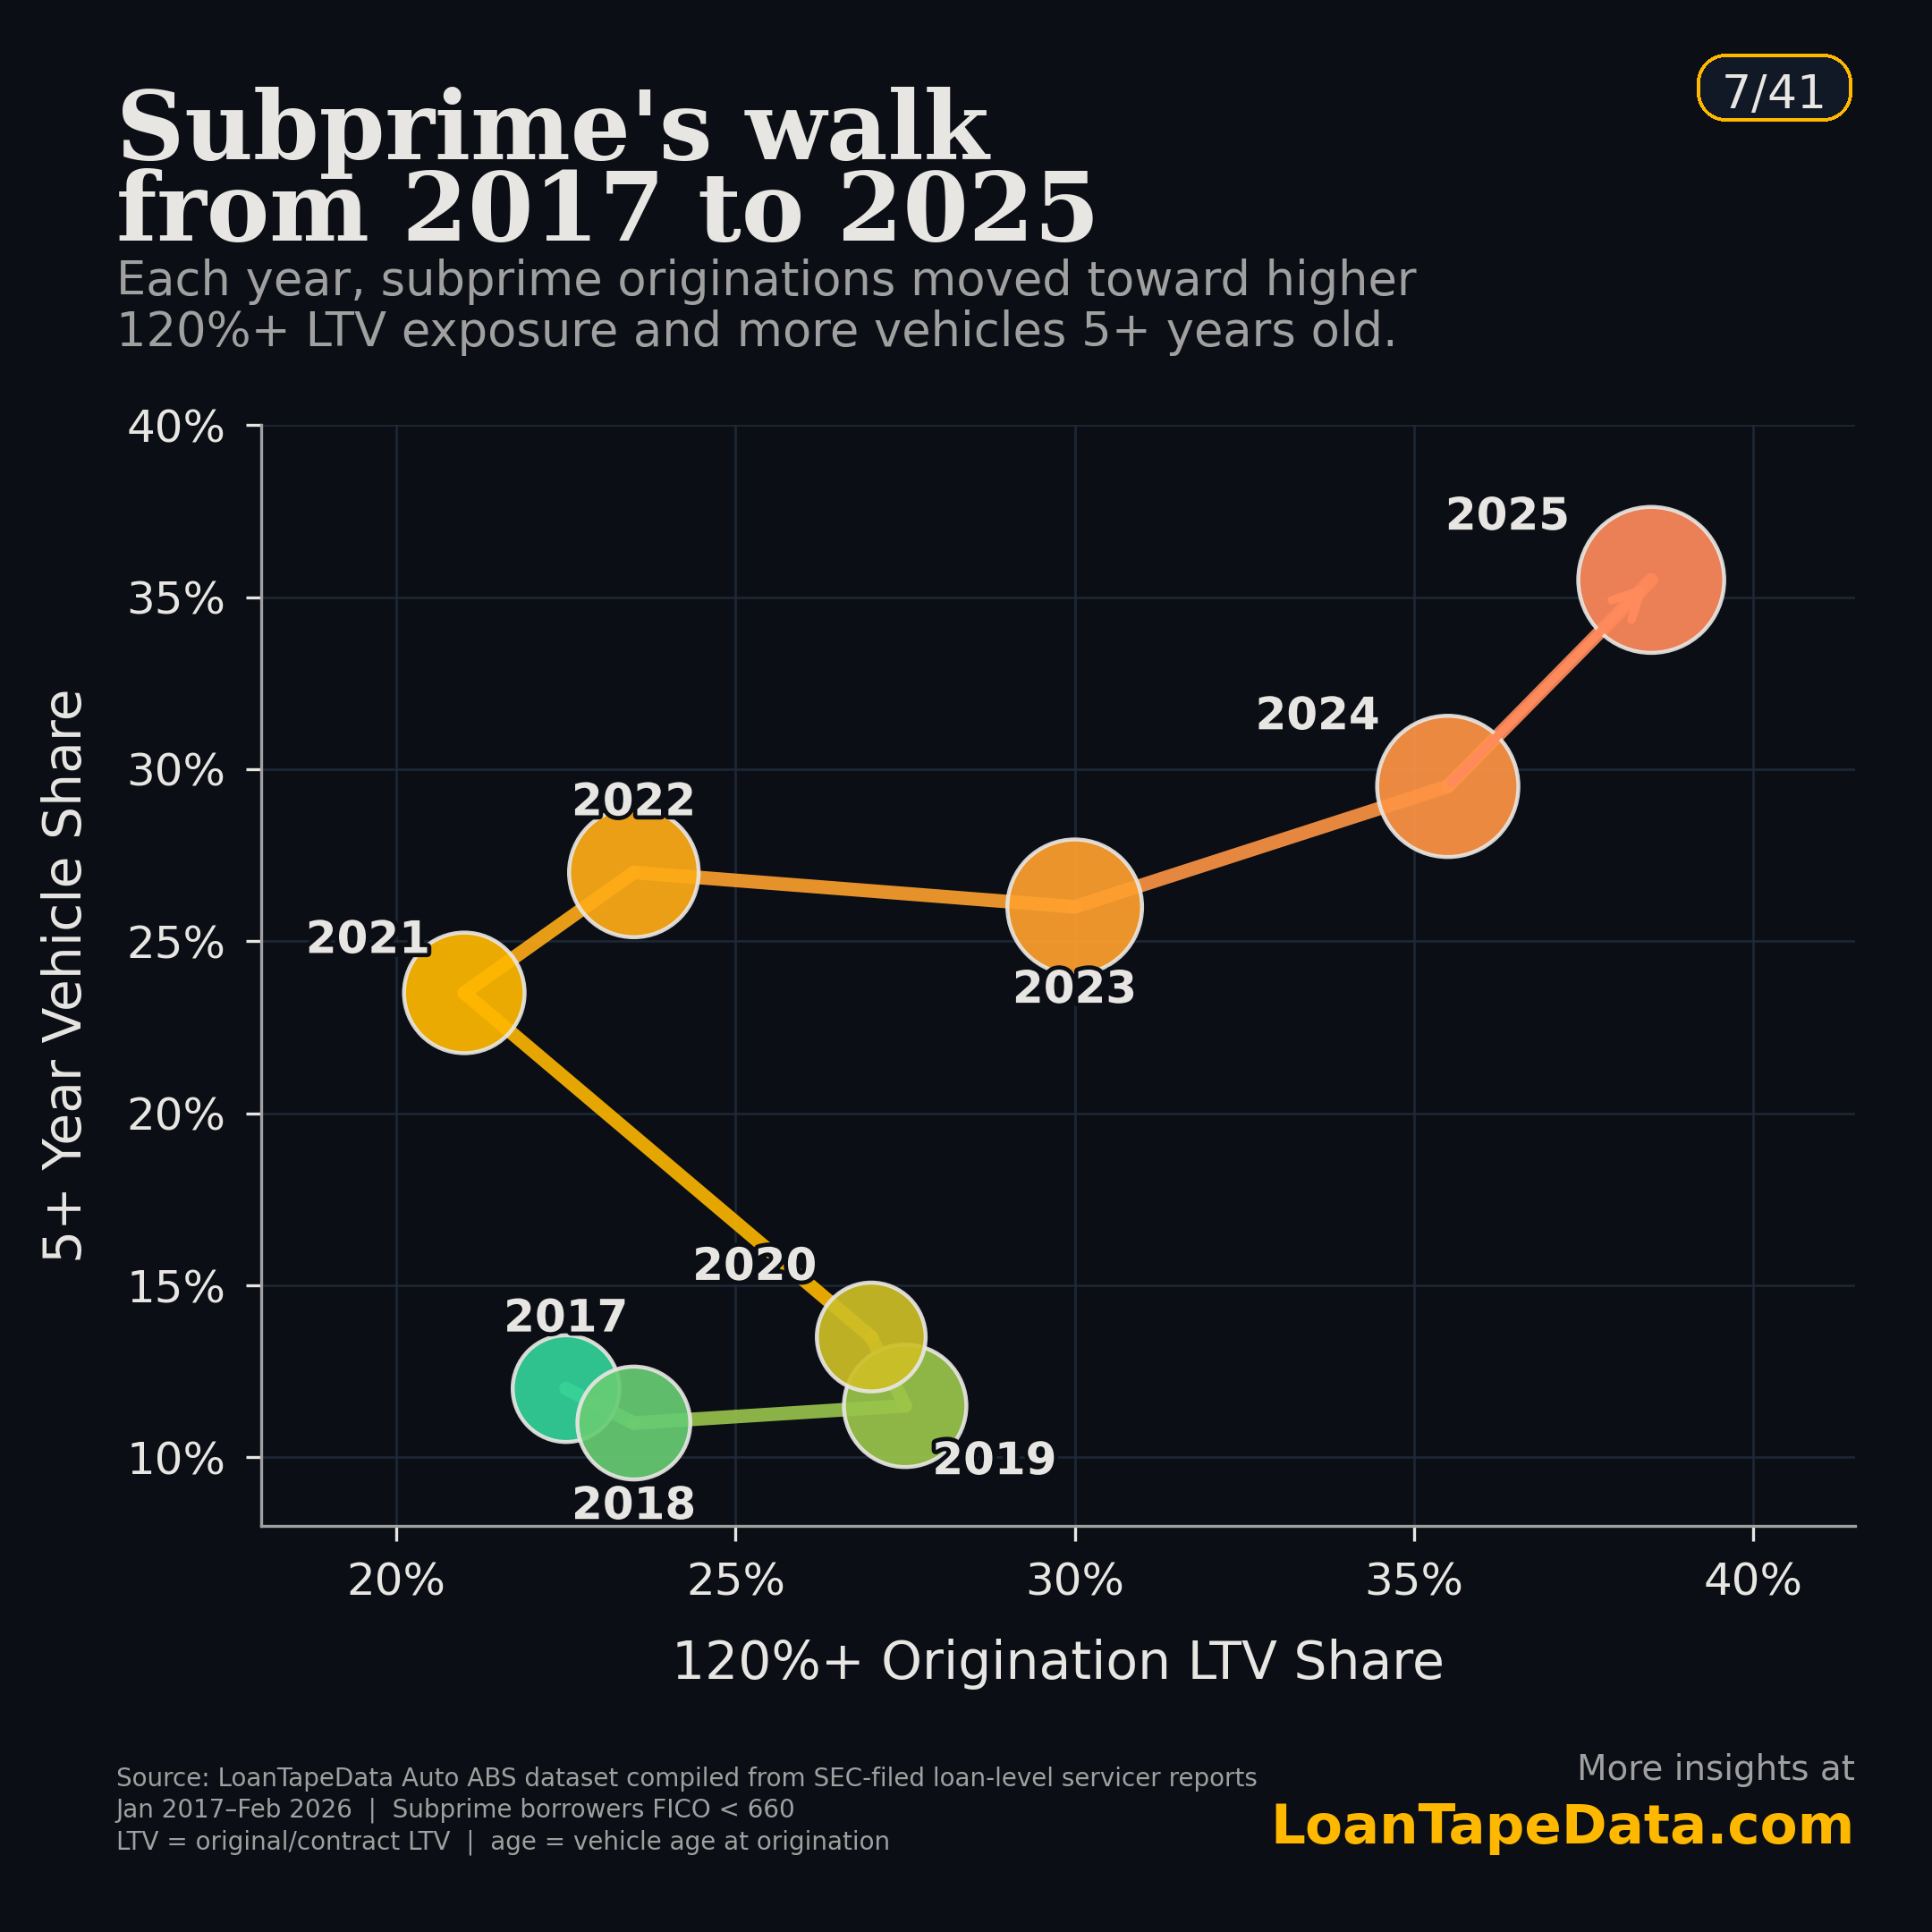
In 2020, about 27% of new subprime auto originations opened above 120% LTV, and roughly 13% were on vehicles five or more years old. Those two flags barely overlapped in the same loan. The next year, the share on older vehicles roughly doubled while high-LTV stayed about flat. Every cohort since has climbed on both axes at the same time.
That gap between the 2020 and 2021 vintages is most of why the subprime auto book looks the way it does now.
What the chart is
Each dot is one origination cohort year. Bubble size scales with total balance written that year. The x-axis is the cohort's share opening above 120% LTV. The y-axis is the share landing on vehicles five or more years old. Subprime here means borrower FICO under 660.
2017 through 2020 sit close together in the lower-middle of the chart. There's meaningful 120%+ LTV exposure across all four years (22 to 28%), but the older-vehicle share doesn't move off about 11 to 13%. Whatever was happening to those cohorts, it was mostly an LTV story.
Then 2021 changes. The cohort comes in at about 21% on high-LTV (actually lower than 2020) but jumps to roughly 24% on older vehicles. That had no obvious 2020 precursor. From 2022 onward both axes climb together, and by 2025 the cohort sits at around 38% high-LTV with over a third of loans on cars five or more years old.
What changed in 2021
Honestly, I don't think anyone has clean attribution on this. There were a lot of moving pieces at once.
Used car prices ran up roughly 40% between January 2020 and the 2022 peak per the Manheim Used Vehicle Value Index. New car inventory collapsed during the chip shortage. So a 2021 subprime borrower walked into a showroom with fewer new cars on the lot, used cars that were ~40% more expensive than two years earlier, and roughly the same income they'd had in 2019. To keep payments inside what those borrowers could carry, lenders stretched terms, accepted higher origination LTVs, and accepted older trade-ins as the collateral.
The first two moves had been part of subprime auto for years. Taking on older trade-ins at scale was the newer thing. Once a full year of subprime production sat on older vehicles, that became the operating posture rather than something the market backed out of in 2022 when used-car prices started softening. The 2022 through 2025 dots tell that story directly.
What that cohort looks like in the active book
The 2021-and-later vintages are now the bulk of outstanding subprime balances. From our prior analysis of the active book, pulled from warehouse data through February 2026:
| Subprime active book | March 2017 | February 2026 | Change |
|---|---|---|---|
| Share with origination LTV under 120% | 72.9% | 64.4% | -8.5 pp |
| Share on vehicles under 5 years old | 86.1% | 51.1% | -35.0 pp |
| Share with both 120%+ LTV and 5+ years | 5.3% | 20.1% | +14.8 pp |
The combo bucket on its own is $9.2B across 525,934 active loans. Nine years ago that bucket was about 5% of subprime collateral. Now it's a fifth.
For comparison on the origination side: the 2018-2019 cohort wrote 6.5% of new subprime loans into that combo bucket. The 2025 cohort wrote 21.8%. Subprime origination collateral didn't loosen gradually. It went 3.4x in seven years on the worst-case bucket.
Why this matters for losses
Expected loss in an auto book is roughly probability of default times loss given default, applied to the balance at risk. The 2021 break pushes both PD and LGD up in the same loans, which is the piece that keeps me up.
LGD is the easier one to reason about. An older vehicle at repo recovers less at auction, so the loss given default per repo is bigger than it was on a 2018-vintage book. Our 2017-2018 charge-off reference shows median severity rising sharply with LTV, and then rising again on top of that across vehicle-age bands. Loans in the combo bucket aren't on one of those gradients, they're on both at once, and they're sitting in a part of the severity grid where the historical reference is thin (because there weren't many of those loans before 2021 to base it on).
PD is the part I'm less sure about, but the direction lines up. Higher origination LTV is a thinner equity cushion, which makes a borrower in trouble walk away faster than one with normal equity. An older car raises the per-year odds of a $2,000 mechanical surprise, and a subprime borrower stretched on payment handles a $2,000 surprise badly. Subprime DQ has kept climbing through 2025 and into early 2026, and the vintages where it's climbed fastest are the same ones with the most aggressive collateral.
You don't need a recession to lose more per dollar of subprime book than you did in 2018. Normal repo flow over a portfolio where both PD and LGD have drifted up in the same loans is enough by itself. The thing that's hard to fix is that most of those terms got locked in at origination, and a 20% combo-bucket book is going to keep bleeding through the early-MOB curves for the next several years regardless of what 2026 originations look like.
What to watch on the 2026 cohort
Two specific markers would say the break is reversing:
- Subprime entrant vehicle age dropping back under 3.0 years. It's at 3.36 today, against a 1.83 pre-2019 baseline.
- Subprime entrant share opening above 120% LTV dropping back under 30%. The 2025 cohort sits near 38%.
I don't expect either of those to land in 2026. Used car prices have come off their 2022 peak but they're still well above 2019 levels, and rates haven't given lenders any room to walk back from term stretching. So my baseline is the 2026 subprime cohort lands somewhere near 2024 and 2025 on this chart, not back at the pre-2021 cluster.
The faster route back is lender-side credit tightening at origination: LTV caps, model-year floors, term caps. A handful of issuers have done some version of that visibly in 2025 issuance docs. Most haven't, and a few have moved the other way.
Methodology
Subprime is borrower FICO under 660 at origination. Vehicle age is the gap between the vehicle model year and the origination month. LTV is original/contract LTV.
The active-book metrics, origination cohort entrant vehicle ages, and combo-bucket origination shares are pulled from the LoanTape warehouse, sourced from SEC-filed loan-level ABS-EE data and monthly Form 10-D remittance reports through February 2026. The phase path chart's per-year dot coordinates here were extracted from the published deep dive deck for the visual; exact warehouse coordinates per year are computed in the deep dive's source pipeline, not republished in this post.
If you want loan-level access to the cohorts behind these numbers, that's what the subscription tiers cover.