Auto Extension Rates Are Above the 2018-19 Average
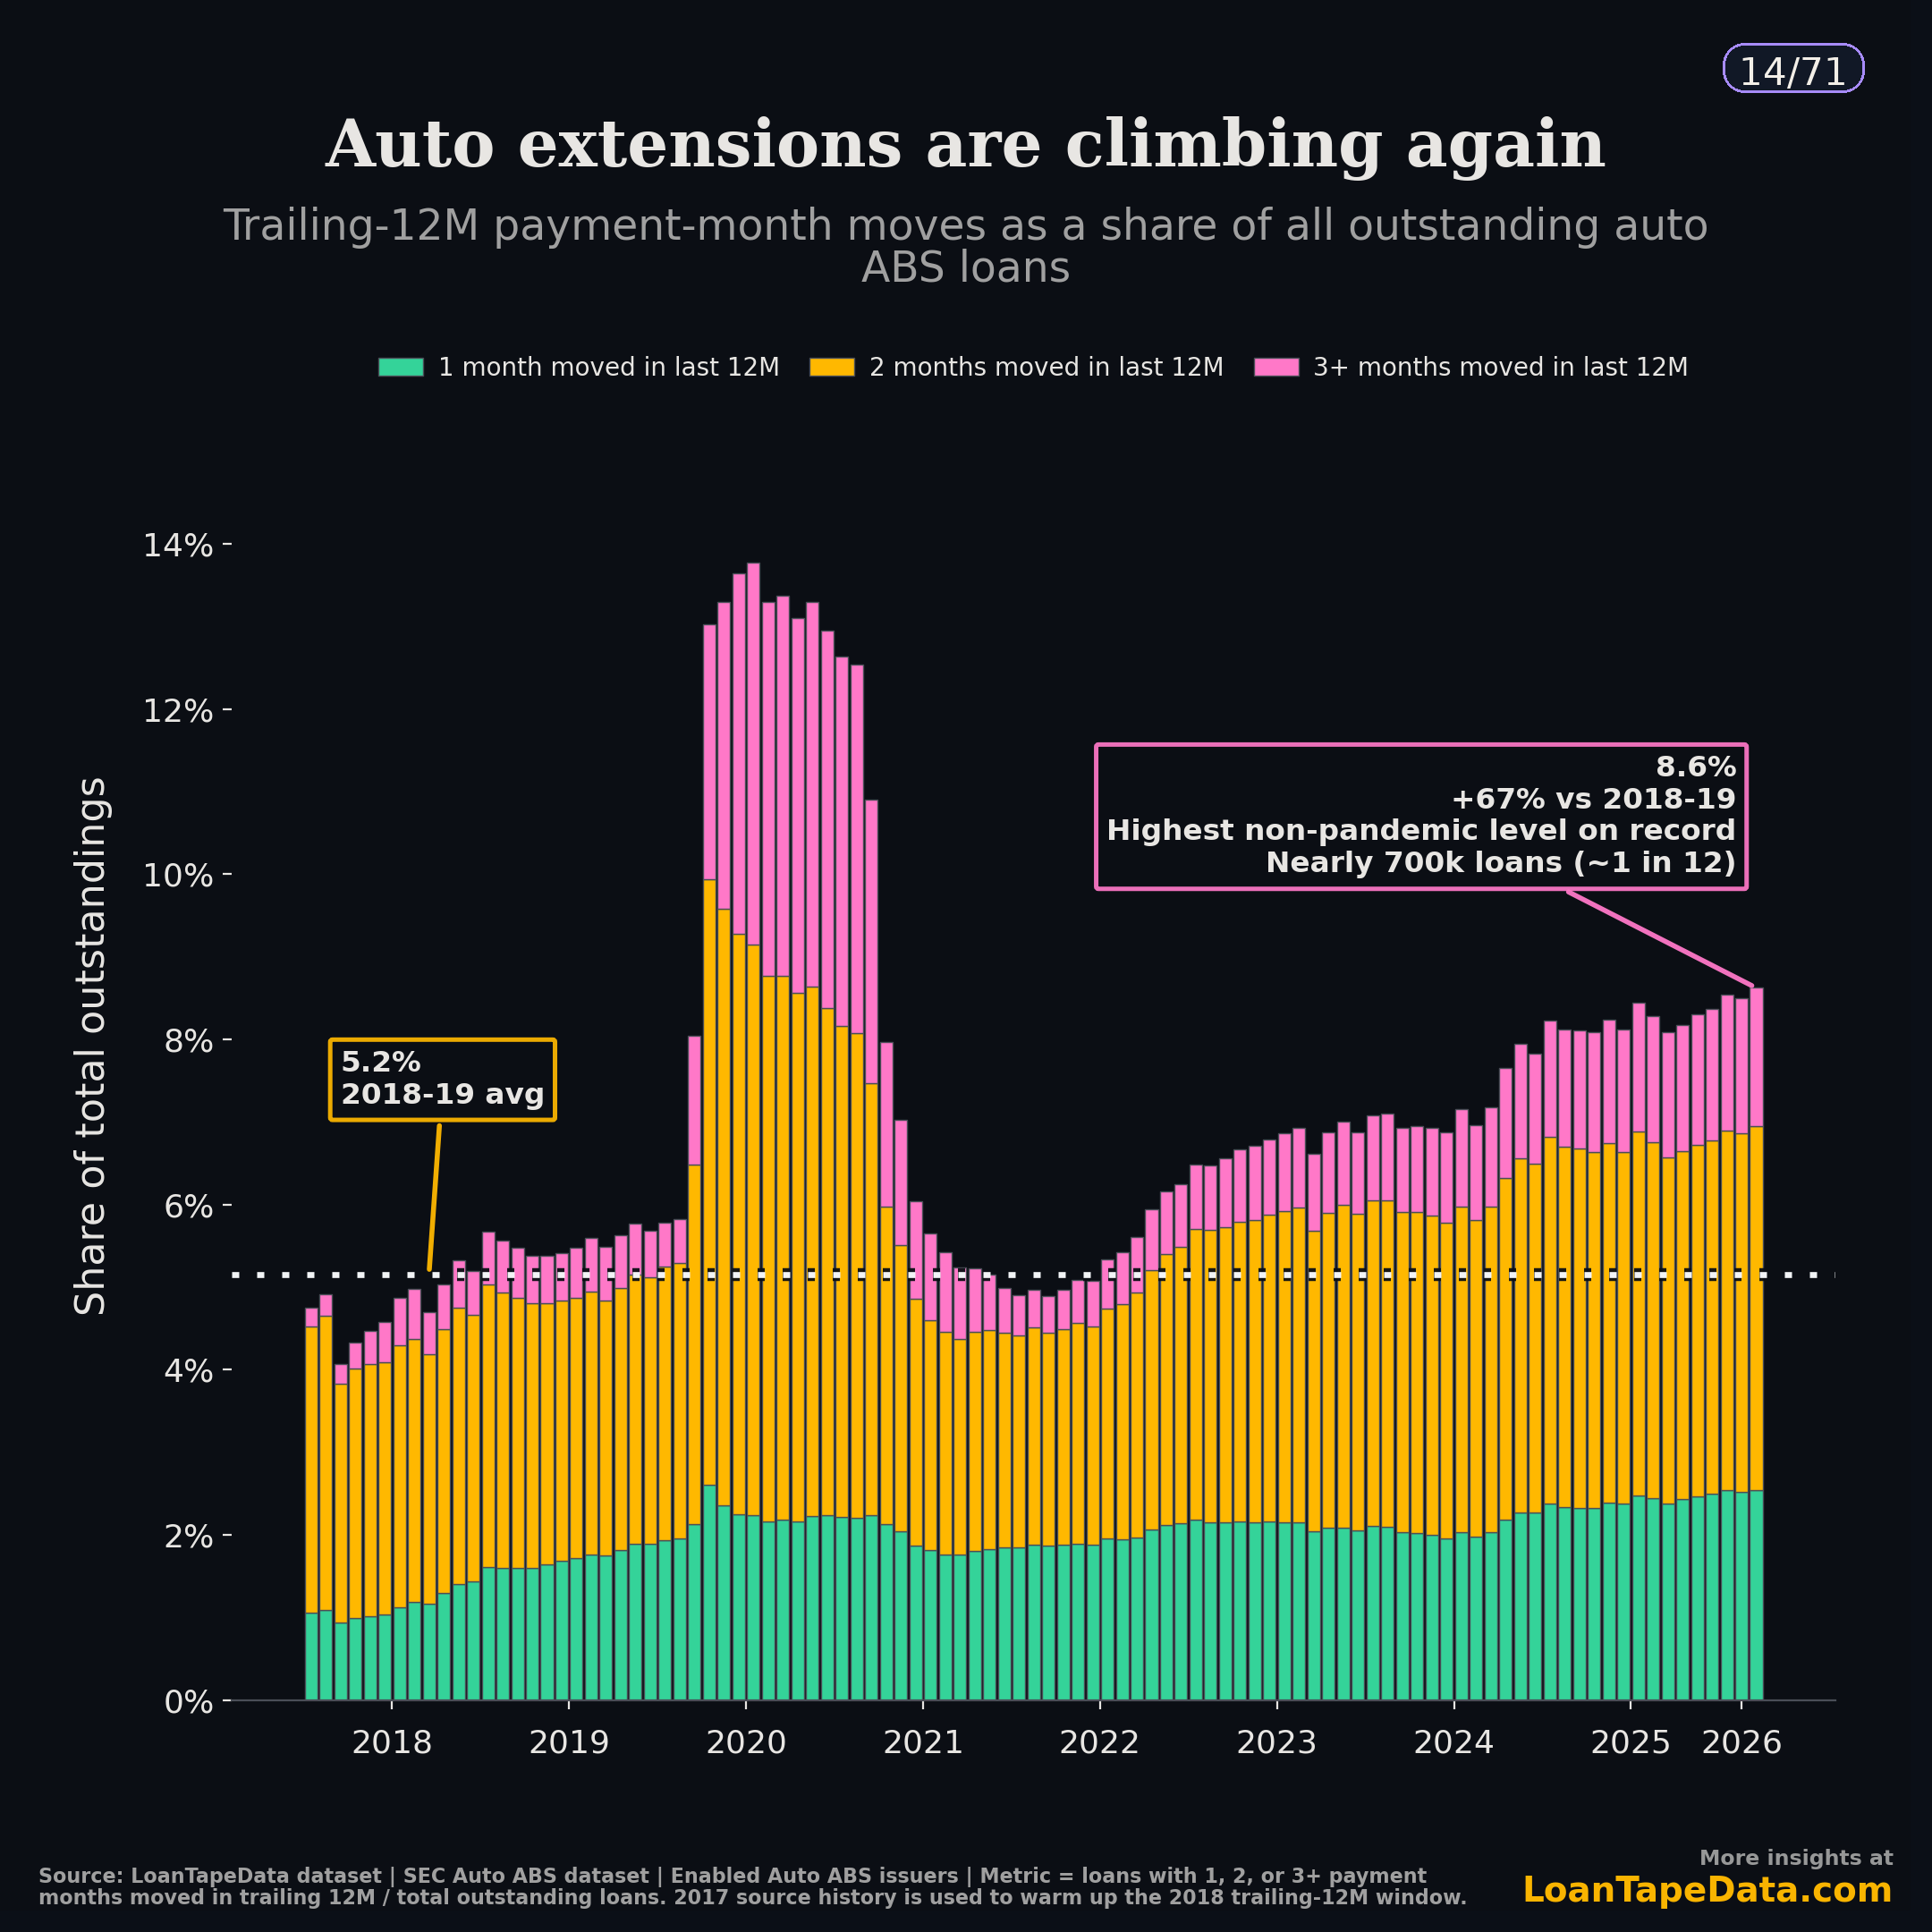
By March 2026, 698,052 outstanding auto ABS loans had at least one payment month moved during the prior 12 months. That is 8.6% of all outstanding loans in the panel, up from a 5.2% 2018-19 average.
Payment extensions are useful to track separately because they affect reported payment timing and may not be captured fully by point-in-time delinquency, loss, or prepayment summaries. The first question is simple: how much payment timing moved? After that, the monitor has to ask whether the moves are one-offs, repeats, and where they cluster.
The aggregate rate is above the 2018-19 average
The chart uses a broad denominator: every outstanding auto ABS loan in the March 2026 panel with a positive balance. On that basis, 8.6% of loans had one or more payment months moved in the trailing 12 months. That compares with a 5.2% average across 2018 and 2019.
The highest point in the full series was 13.8% in July 2020. For comparison with pre-pandemic conditions, the 2018-19 average is the cleaner baseline used here. Compared with that baseline, March 2026 is 67% higher.
| Trailing-12M moved-month bucket | 2018-19 avg | Mar 2026 | Change |
|---|---|---|---|
| 1 month moved | 1.4% | 2.5% | +1.1 pp |
| 2 months moved | 3.2% | 4.4% | +1.2 pp |
| 3+ months moved | 0.5% | 1.7% | +1.1 pp |
| Total with any moved month | 5.2% | 8.6% | +3.5 pp |
The count matters as much as the percentage. The March 2026 source file has 8.09 million outstanding loans and $156.1 billion of outstanding balance. The 698,052 loans with moved payment months are roughly one in every 12 outstanding loans in the panel.
Active-month and trailing-12-month measures differ
A point-in-time modification table will miss part of this story. In March 2026, only 0.9% of eligible loans were actively extended in that month. The trailing-12-month moved-month rate was 9.3% in the eligible-book publication frame.
The gap shows that the active-month view captures a smaller population than the trailing-12-month moved-month measure. An extension can leave the active field after the reporting month, while the loan can still appear in the trailing moved-month measure. A monitor that only asks what is active this month will undercount loans with reported payment timing movement during the prior year.
| Segment | Active extension rate, Mar 2026 | Any moved month, trailing 12M | 2+ moved months, trailing 12M |
|---|---|---|---|
| All | 0.9% | 9.3% | 6.6% |
| Prime | 0.3% | 3.4% | 1.9% |
| Subprime | 2.3% | 22.8% | 17.1% |
The subprime row illustrates the difference between stock and flow measures: 2.3% of eligible subprime loans were actively extended in March 2026, while 22.8% had at least one moved payment month during the prior 12 months.
Repeat moved months show greater extension depth
A one-month extension and a three-month extension do not mean the same thing. A single moved payment and three or more moved payments describe different levels of extension depth. Three or more moved months inside a year indicates more reported payment timing movement for the loan.
The pink top of the stack shows the 3+ moved-month bucket. That bucket rose from 0.5% of outstandings in 2018-19 to 1.7% in March 2026. In percentage-point terms, that increase is about the same as the one-month bucket. In relative terms, it is more than three times the old baseline.
The borrower-segment split shows a larger increase for subprime than prime. In the eligible-book publication frame, subprime moved from a high baseline to a higher current level. Prime rose too, but from a smaller base.
| Segment | 2018-19 any moved TTM | Mar 2026 any moved TTM | 2018-19 3+ moved TTM | Mar 2026 3+ moved TTM |
|---|---|---|---|---|
| Prime | 2.0% | 3.4% | 0.2% | 0.4% |
| Subprime | 14.9% | 22.8% | 1.6% | 5.1% |
In the cited segment table, the largest increase is in subprime repeat-extension measures. The subprime multiple-extension rate, measured as loans with two or more extension events in the trailing 12 months, was 4.6% in March 2026 versus a 1.6% 2018-19 average. Prime was 0.5% versus 0.2%.
That does not mean every loan with an extension has the same risk profile. It means the surveillance cut needs to separate one-time payment movement from repeated movement. A pool-level delinquency measure and a trailing extension-flow measure can describe different aspects of borrower payment status.
Delinquency stage shows where extensions cluster
In the March 2026 data, extension rates vary by borrower segment and starting delinquency stage. Subprime loans that started the month current or less than 30 days past due had a 1.3% extension-event rate. Subprime loans already 60-89 days delinquent had a 9.9% extension-event rate.
The moved-month depth is even more concentrated.
| Subprime starting DQ stage | Extension-event rate | 2+ moved-month TTM | 3+ moved-month TTM |
|---|---|---|---|
| Current / <30 DPD | 1.3% | 13.1% | 3.4% |
| 30-59 DPD | 7.3% | 37.9% | 12.5% |
| 60-89 DPD | 9.9% | 43.2% | 17.7% |
| 90+ DPD | 9.5% | 43.8% | 21.5% |
That pattern is what makes extension monitoring different from a normal delinquency table. A 60-89 DPD subprime loan is already visible in a standard roll-rate report. The extension layer asks a second question: how much reported payment timing movement has already occurred before the next reported state?
Prime has the same shape, but at lower levels. In March 2026, prime 60-89 DPD loans had a 7.8% extension-event rate and a 9.8% 3+ moved-month TTM rate. Prime current or sub-30 DPD loans were far lower: 0.2% on extension-event rate and 0.3% on 3+ moved months.
A pool-level extension rate can be supplemented with segment, starting-delinquency, and issuer-level cuts, with the 3+ moved-month rate shown separately. That is where one moved payment starts to look different from repeated payment timing movement.
Post-extension outcomes need forward observation
The outcome file requires additional forward observation, so the post-extension severity read currently stops at September 2025 cohorts. The reason is measurement timing: if we ask what happened one or two months after an extension, the most recent cohorts do not have enough forward observation yet.
For September 2025 extension cohorts, the table shows material delinquency rates one and two months after the extension month.
| Segment | >1 DPD one month later | >10 DPD one month later | >30 DPD two months later |
|---|---|---|---|
| Prime | 42.9% | 31.0% | 18.8% |
| Subprime | 69.2% | 57.3% | 39.9% |
This table is descriptive, not a matched-control causal estimate. It does not say the extension caused the later delinquency. It says that the population receiving extensions still had a large amount of near-term delinquency after the extension month.
That is the surveillance use case. Extensions may be associated with different subsequent payment paths. The monitoring question is whether loans with reported extension activity later return to current status, remain delinquent, or roll further delinquent.
Next monthly cuts
The next few monthly cuts can start with the all-auto 3+ moved-month bucket. Does it remain near the March 2026 level of 1.7%, increase, or decline? That bucket is small, but it is the part of the stack most tied to repeated payment timing movement.
The subprime depth measure is the second cut. If subprime 3+ moved-month TTM holds around the March 2026 level of 5.1%, it remains above the 1.6% 2018-19 average. If it keeps moving higher, the data would show more extension depth rather than only more borrowers with one moved payment. The delinquent subprime buckets carry the highest 3+ moved-month rates in the table: in March, 60-89 DPD carried a 17.7% rate, and 90+ DPD carried 21.5%.
Those are the buckets where changes in reported extension behavior would most affect the interpretation of the delinquency tape. If extension flow rises while headline delinquency stays flat, the two measures should be read together rather than treating delinquency alone as the full picture. If extension flow rises and delinquency rises with it, the extension data points to a broader change in reported borrower status.
Methodology note
This analysis uses the March 2026 Auto ABS modification-effectiveness monitor built from SEC-filed loan-level servicer reports. The extension definition is a positive normalized payment_extended_number value or SEC modification_type_code 4/04. The raw ABS-EE source field maps through paymentExtendedNumber; the normalized monitor treats it as a reporting-period value, not a lifetime cumulative counter.
The main chart sums payment months moved over the trailing 12 months and divides loans with 1, 2, or 3+ moved months by total outstanding loans with positive balances. The 2017 source history is used only to warm up the 2018 trailing-12-month window. For the non-pandemic comparison, I exclude 2020 through June 2021.
A stricter denominator that requires a full 12 months of observation produces a higher March 2026 total moved rate: 11.5% across the full panel, 4.1% for prime, and 28.5% for subprime. I used the broader outstanding-loan denominator for the headline chart because it reads closest to portfolio surveillance: of the loans outstanding right now, how many have had payment timing moved in the last year?
The data sits on the same loan-level infrastructure behind the LoanTape ABS-EE dataset, Form 10-D data, and ABS remittance data. The full subscriber deck is available in the Modification Effectiveness Deep Dive. For issuer, trust, and borrower-bucket cuts, see LoanTape pricing.