What September 2025 Auto Extensions Did Next
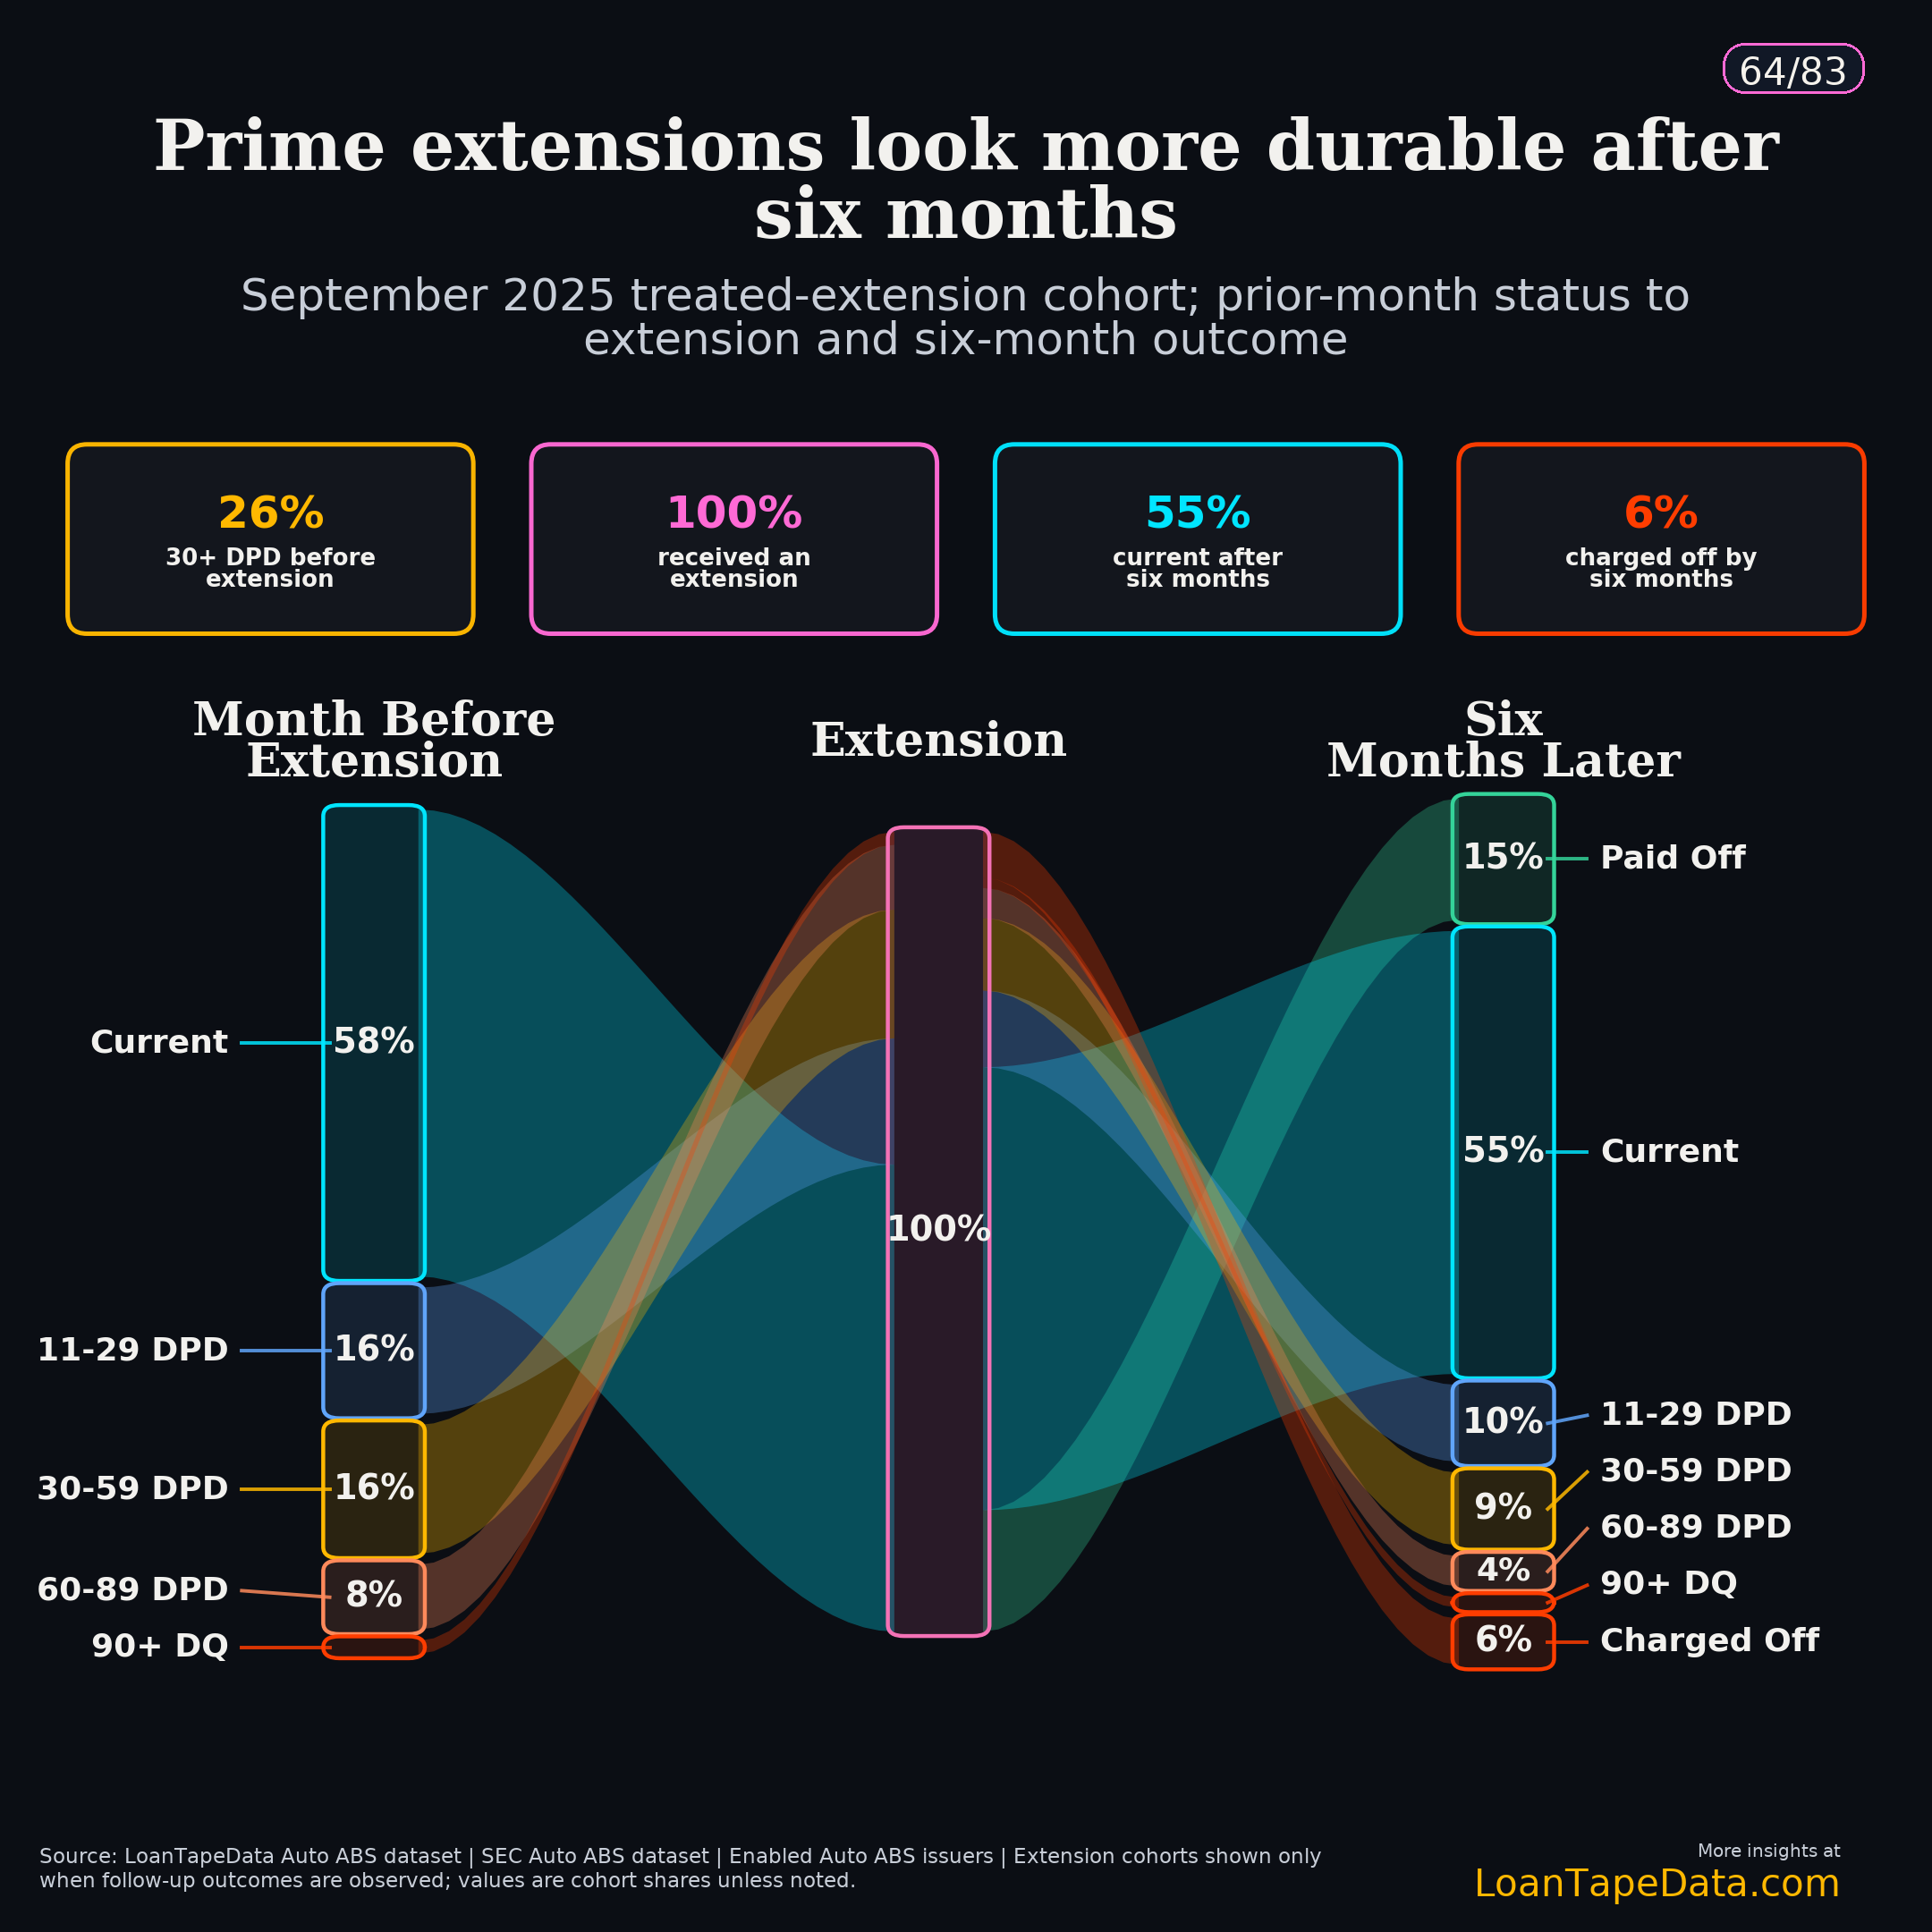
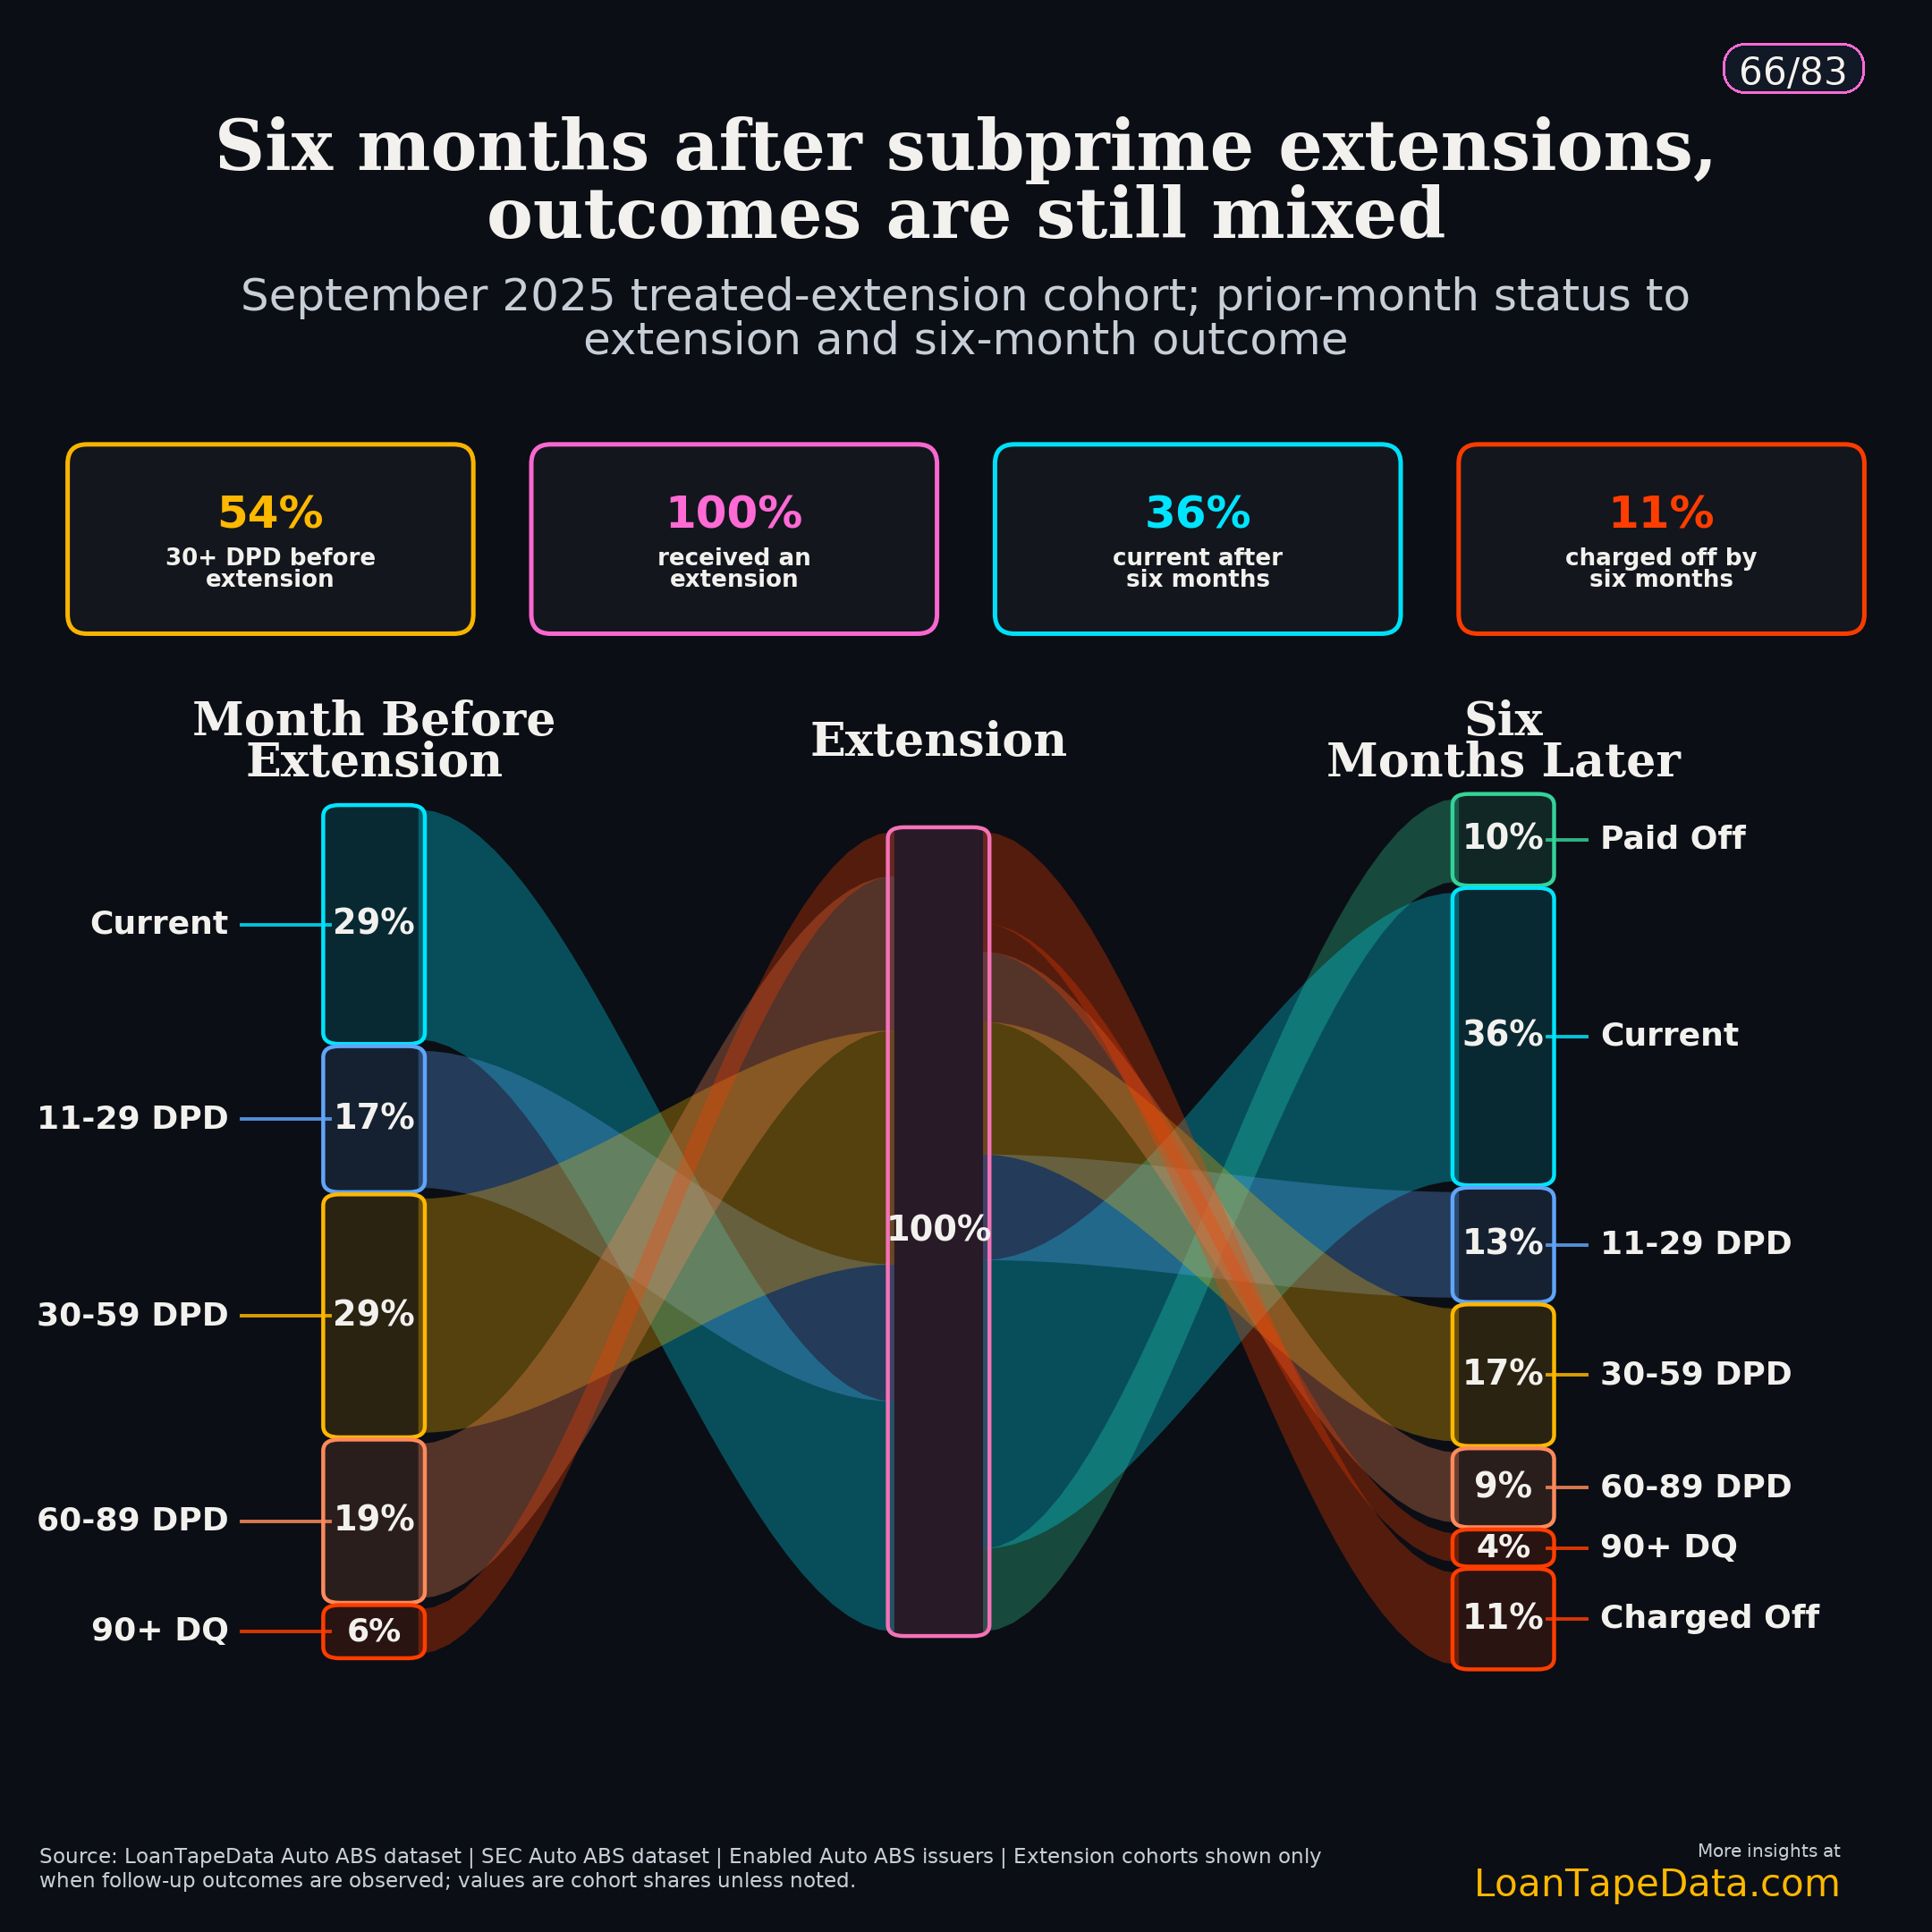
September 2025 is where the extension story stops being abstract. It is the latest cohort in the March 2026 package with a full six months of follow-up: 63,151 subprime loans received an extension, and six months later 36.1% were current or 0-10 days past due while 11.5% had charged off. The prime extension cohort was smaller and cleaner: 19,198 loans, 55.4% current or 0-10 DPD after six months, and 5.8% charged off.
That is too much movement to bury inside one modification flag. A payment extension moves timing. After that, the loan still has to prove something. Did the borrower stay current? Did the loan slide back into delinquency? Did it pay off or charge off? The Sankey charts are busy, but they answer the right question because they keep the loan path attached to the extension event.
Start with the month before the extension
Read the chart from left to right. The left column is the loan's delinquency bucket in the month before the extension. The middle is the extension. The right side is where the loan landed six months later. The four-stage version adds a one-month checkpoint, which matters because a loan can look much better right after a payment date moves and then drift back into delinquency.
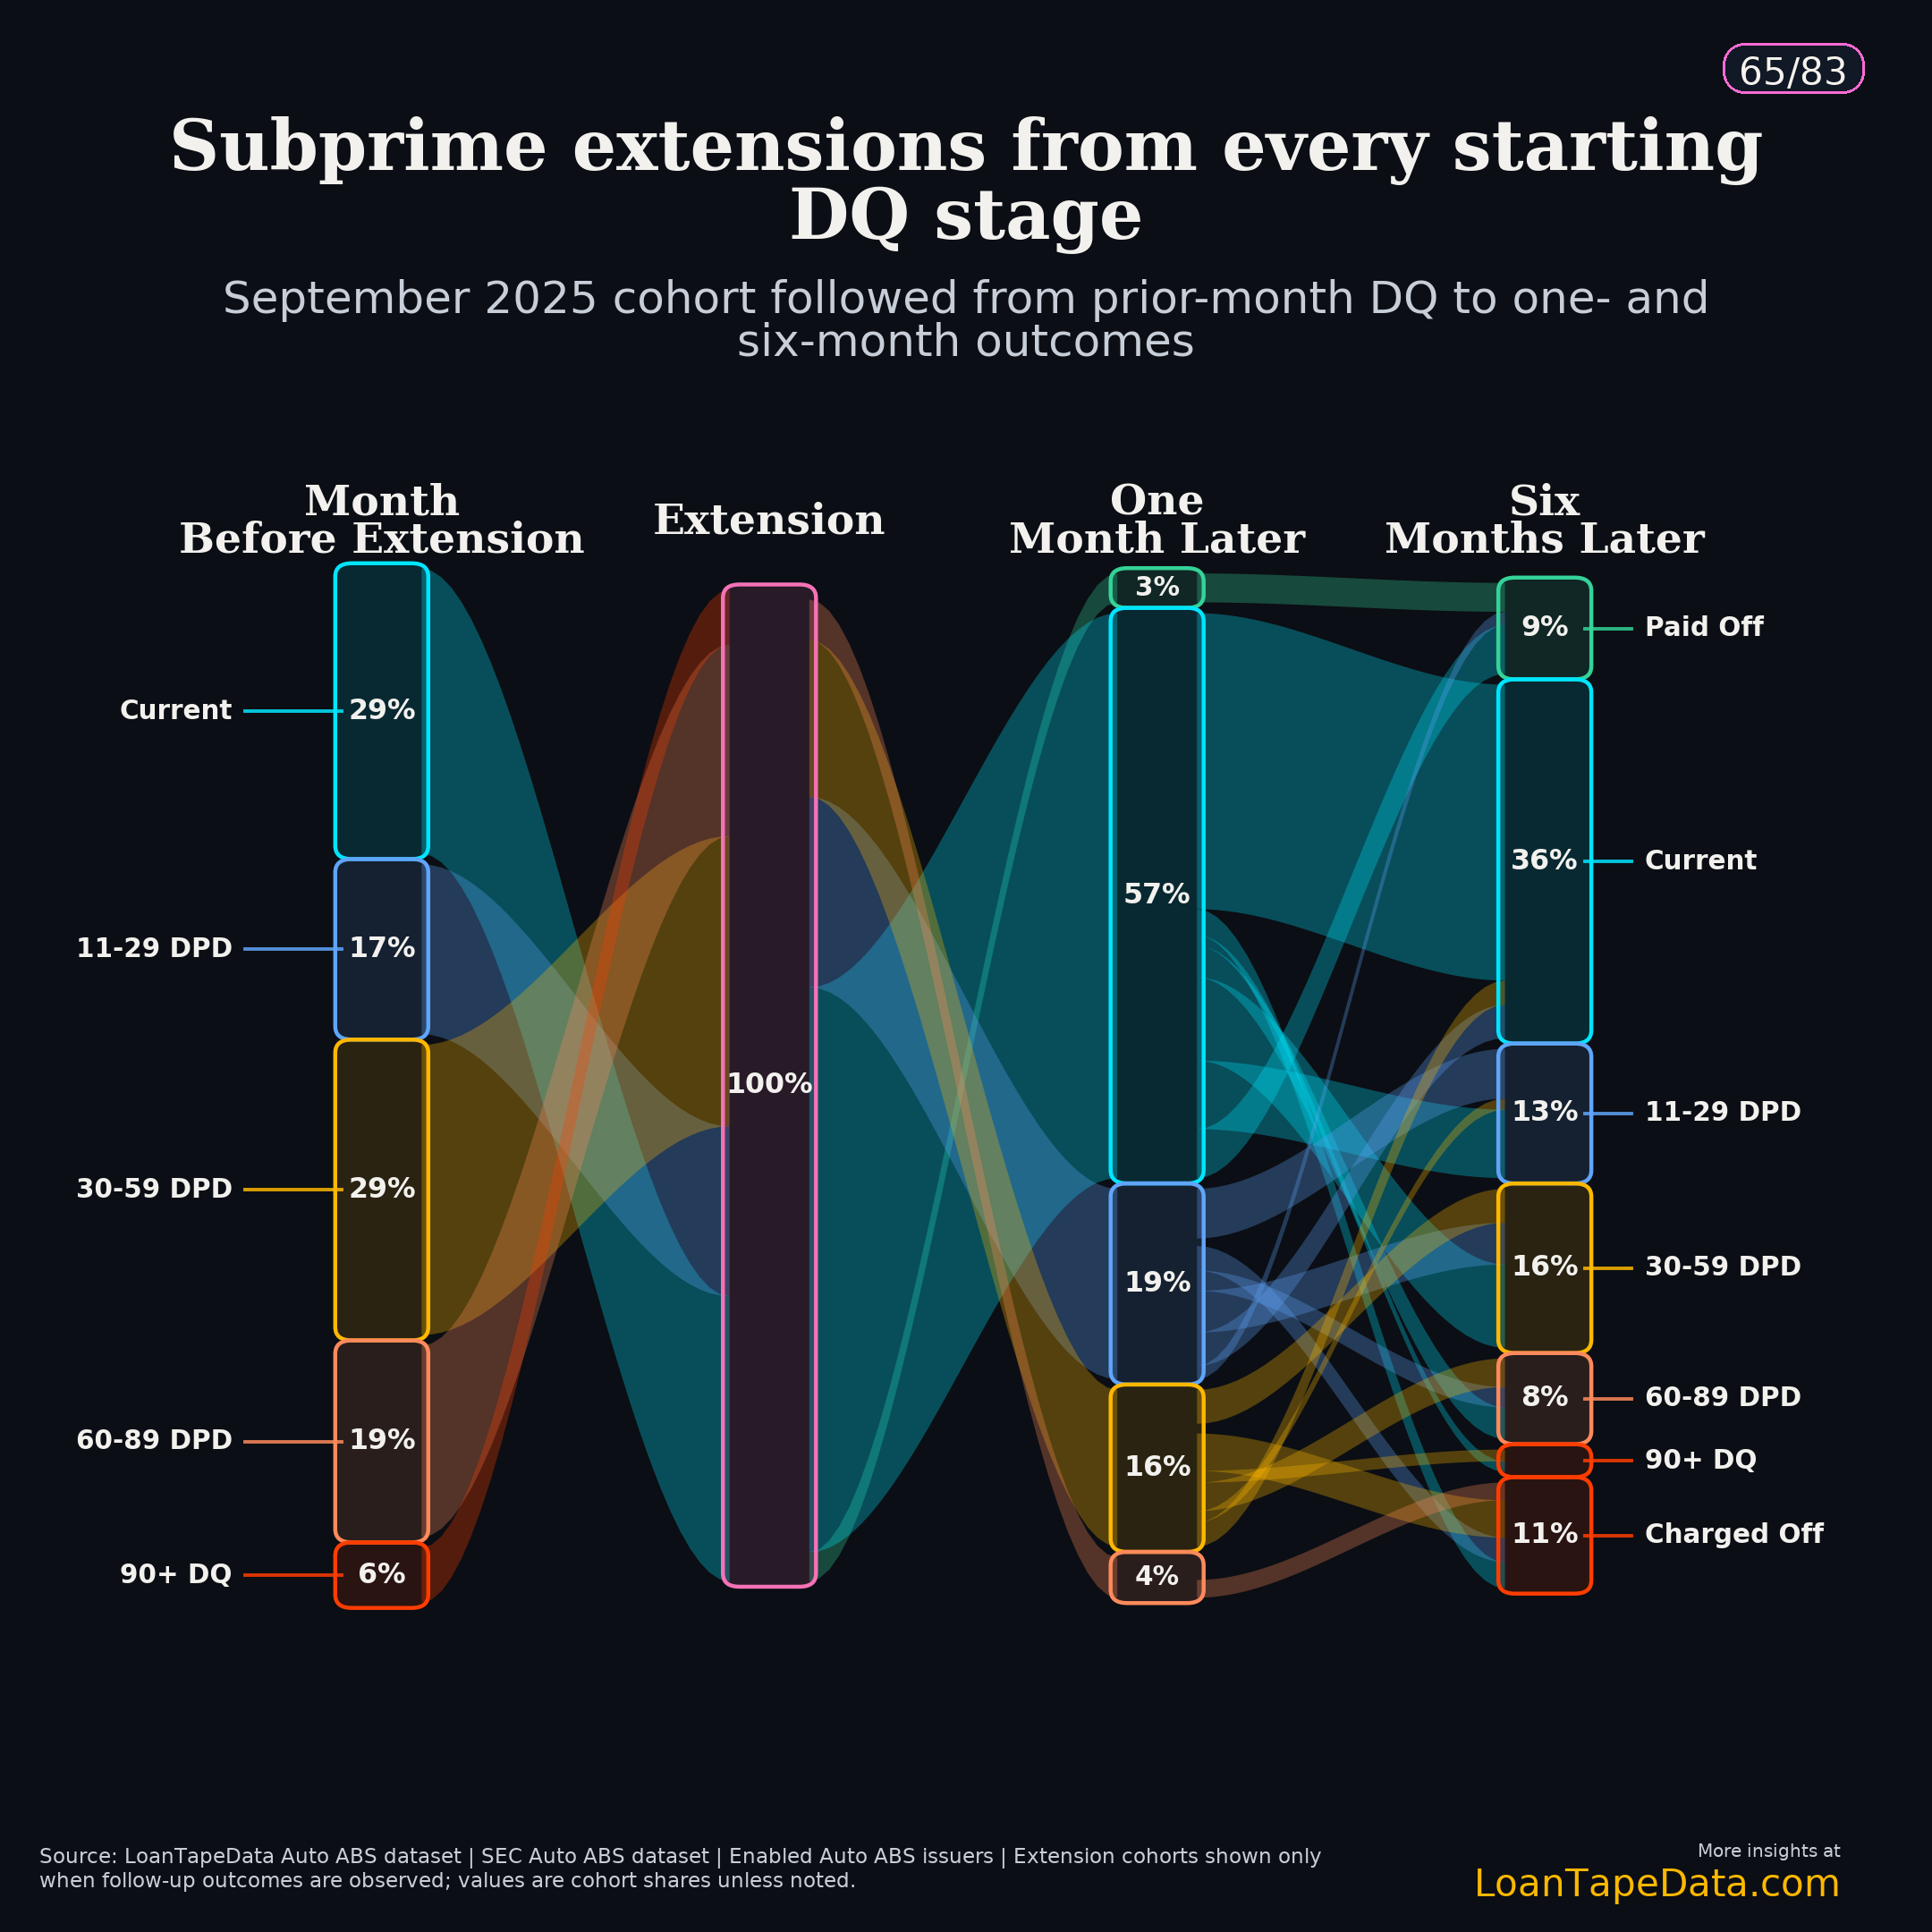
Prime and subprime start from very different places. In September 2025, 58.4% of prime extension loans were current or 0-10 DPD in the month before extension. Only 25.8% were 30+ DPD. Subprime was much rougher: 28.8% current or 0-10 DPD, and 54.1% already 30+ DPD before the extension.
| September 2025 extension cohort | Loans | 30+ DPD before extension | Current / 0-10 DPD after 1M | Current / 0-10 DPD after 6M | Charged off after 6M |
|---|---|---|---|---|---|
| Prime | 19,198 | 25.8% | 76.4% | 55.4% | 5.8% |
| Subprime | 63,151 | 54.1% | 57.0% | 36.1% | 11.5% |
This is the first thing I would not flatten. Some extensions look like current-book payment timing adjustments. Others are delinquency work-outs. Subprime extensions are far more likely to begin with a loan that was already late. That does not make the extension good or bad, but it changes the follow-up.
Do not trust the first month too much
The first month after extension can flatter the result. In the September 2025 subprime flow, 57.0% of extended loans were current or 0-10 DPD one month later. Six months later, that share was 36.1%. Another 42.1% sat somewhere from 11 DPD to 90+ DPD, 10.4% had paid off, and 11.5% had charged off.
Prime did better, but the fade was still there. Prime extensions were 76.4% current or 0-10 DPD after one month. Six months later, 55.4% were still current or 0-10 DPD, 23.8% were 11+ DPD, 15.2% had paid off, and 5.8% had charged off.
That gap is the useful part. The first month can capture the mechanical effect of moving a payment. The six-month path tells you whether the borrower actually made it back to a better payment pattern.
The cleaner comparison is the 30-59 DPD entry cohort, where every loan starts from the same prior-month delinquency bucket. September 2025 had 3,090 prime 30-59 DPD extension loans and 18,481 subprime 30-59 DPD extension loans.
| Prior-month 30-59 DPD extension cohort | Loans | Current / 0-10 DPD after 1M | Current / 0-10 DPD after 6M | Still 30+ DPD after 6M | Charged off after 6M |
|---|---|---|---|---|---|
| Prime | 3,090 | 57.8% | 36.2% | 30.1% | 9.8% |
| Subprime | 18,481 | 48.8% | 27.5% | 37.8% | 11.4% |
A one-month cure rate is worth tracking. It is not durable performance. The six-month state path catches the loans that roll back into delinquency after the timing reset.
The same source also has a control read on 30-59 DPD loans that did not receive a current extension. Six months later, untreated prime loans charged off at 16.5% and untreated subprime loans charged off at 18.0%, versus 9.8% and 11.4% for the treated cohorts. I would not treat that as causal. Servicers choose which borrowers get worked, and borrower response matters. But it does tell us that delinquency alone is missing part of the servicing story.
Repeat extensions are the part I would watch
The Sankey tells you direction. The repeat-extension cut tells you depth.
Among September 2025 loans that started from 30-59 DPD and received an extension, 65.4% of prime loans were on their first distinct extension event in the trailing 12 months. Subprime had more repeat activity: 53.8% were first-extension loans, 34.1% were on a second extension, and 12.1% were already at three or more distinct extension events in the trailing 12 months.
The outcomes get weaker as the extension sequence gets deeper. For subprime 30-59 DPD borrowers, the first-extension group had a 29.5% current / 0-10 DPD share after six months and a 10.3% chargeoff share. The 3+ extension group had a 20.8% current / 0-10 DPD share and a 15.1% chargeoff share.
| Segment | Extension sequence in trailing 12M | Share of treated 30-59 cohort | Current / 0-10 DPD after 6M | Charged off after 6M |
|---|---|---|---|---|
| Prime | First extension | 65.4% | 38.4% | 9.7% |
| Prime | Second extension | 28.2% | 32.9% | 9.2% |
| Prime | 3+ extensions | 6.3% | 28.6% | 13.3% |
| Subprime | First extension | 53.8% | 29.5% | 10.3% |
| Subprime | Second extension | 34.1% | 26.9% | 11.9% |
| Subprime | 3+ extensions | 12.1% | 20.8% | 15.1% |
That is what an aggregate extension rate hides. Two pools can report the same active extension rate and still have very different repeat-extension mixes. One pool may be mostly first-time payment moves. Another may be leaning harder on borrowers who already needed help earlier in the year.
The FICO split adds one more warning label. In the prime 30-59 extension cohort, 54.6% of treated loans were in the 660-699 band. In the subprime 30-59 cohort, 54.9% were below 580. Same starting DQ bucket, different borrower mix.
What this changes in surveillance
I would not stop at the extension rate. That rate tells us how often payment timing moved. It does not tell us whether the move held.
The better monthly read is the spread between one-month cure and six-month durability. If the one-month current share rises while the six-month current share falls, the pool is getting more short-lived relief. If the six-month current share improves without a chargeoff spike, the cohort is behaving better.
The repeat-extension mix is the other check. A higher share of second and 3+ extension borrowers changes the risk read even when total extension volume is flat. In the September 2025 30-59 DPD subprime cut, the 3+ group was only 12.1% of treated loans, but it had the weakest six-month current share and the highest chargeoff share among the extension sequence groups.
That is why the Sankey is useful. It turns a modification field into a path: where the loan started, whether payment timing moved, and where the borrower landed after follow-up. Pool summaries can miss that.
Methodology note
This post uses the March 2026 Auto ABS modification-effectiveness monitor built from SEC-filed loan-level servicer reports. September 2025 is the latest cohort in this package with six months of observable follow-up. The extension definition is a positive normalized payment_extended_number value or SEC modification_type_code 4/04. The raw ABS-EE fields map from paymentExtendedNumber and modificationTypeCode into the normalized monitor.
The all-entry Sankey includes treated extension loans from every prior-month delinquency bucket. The 30-59 DPD tables use a narrower prior-month delinquency cut so the entry bucket is fixed. FICO segments use borrower credit score at origination: prime is 660 and above, subprime is below 660. Terminal exits are resolved as paid off or charged off from the normalized loan-month records.
This is descriptive surveillance, not a causal claim about extensions. Servicer selection, borrower contact, collateral status, and borrower willingness to pay all affect which loans receive extensions. The purpose is to track what happened after the payment timing moved.
The same loan-level infrastructure powers LoanTape's ABS-EE dataset, Form 10-D data, and ABS remittance data. The full subscriber deck is available in the Modification Effectiveness Deep Dive. For issuer, trust, and borrower-bucket extension cuts, see LoanTape pricing.