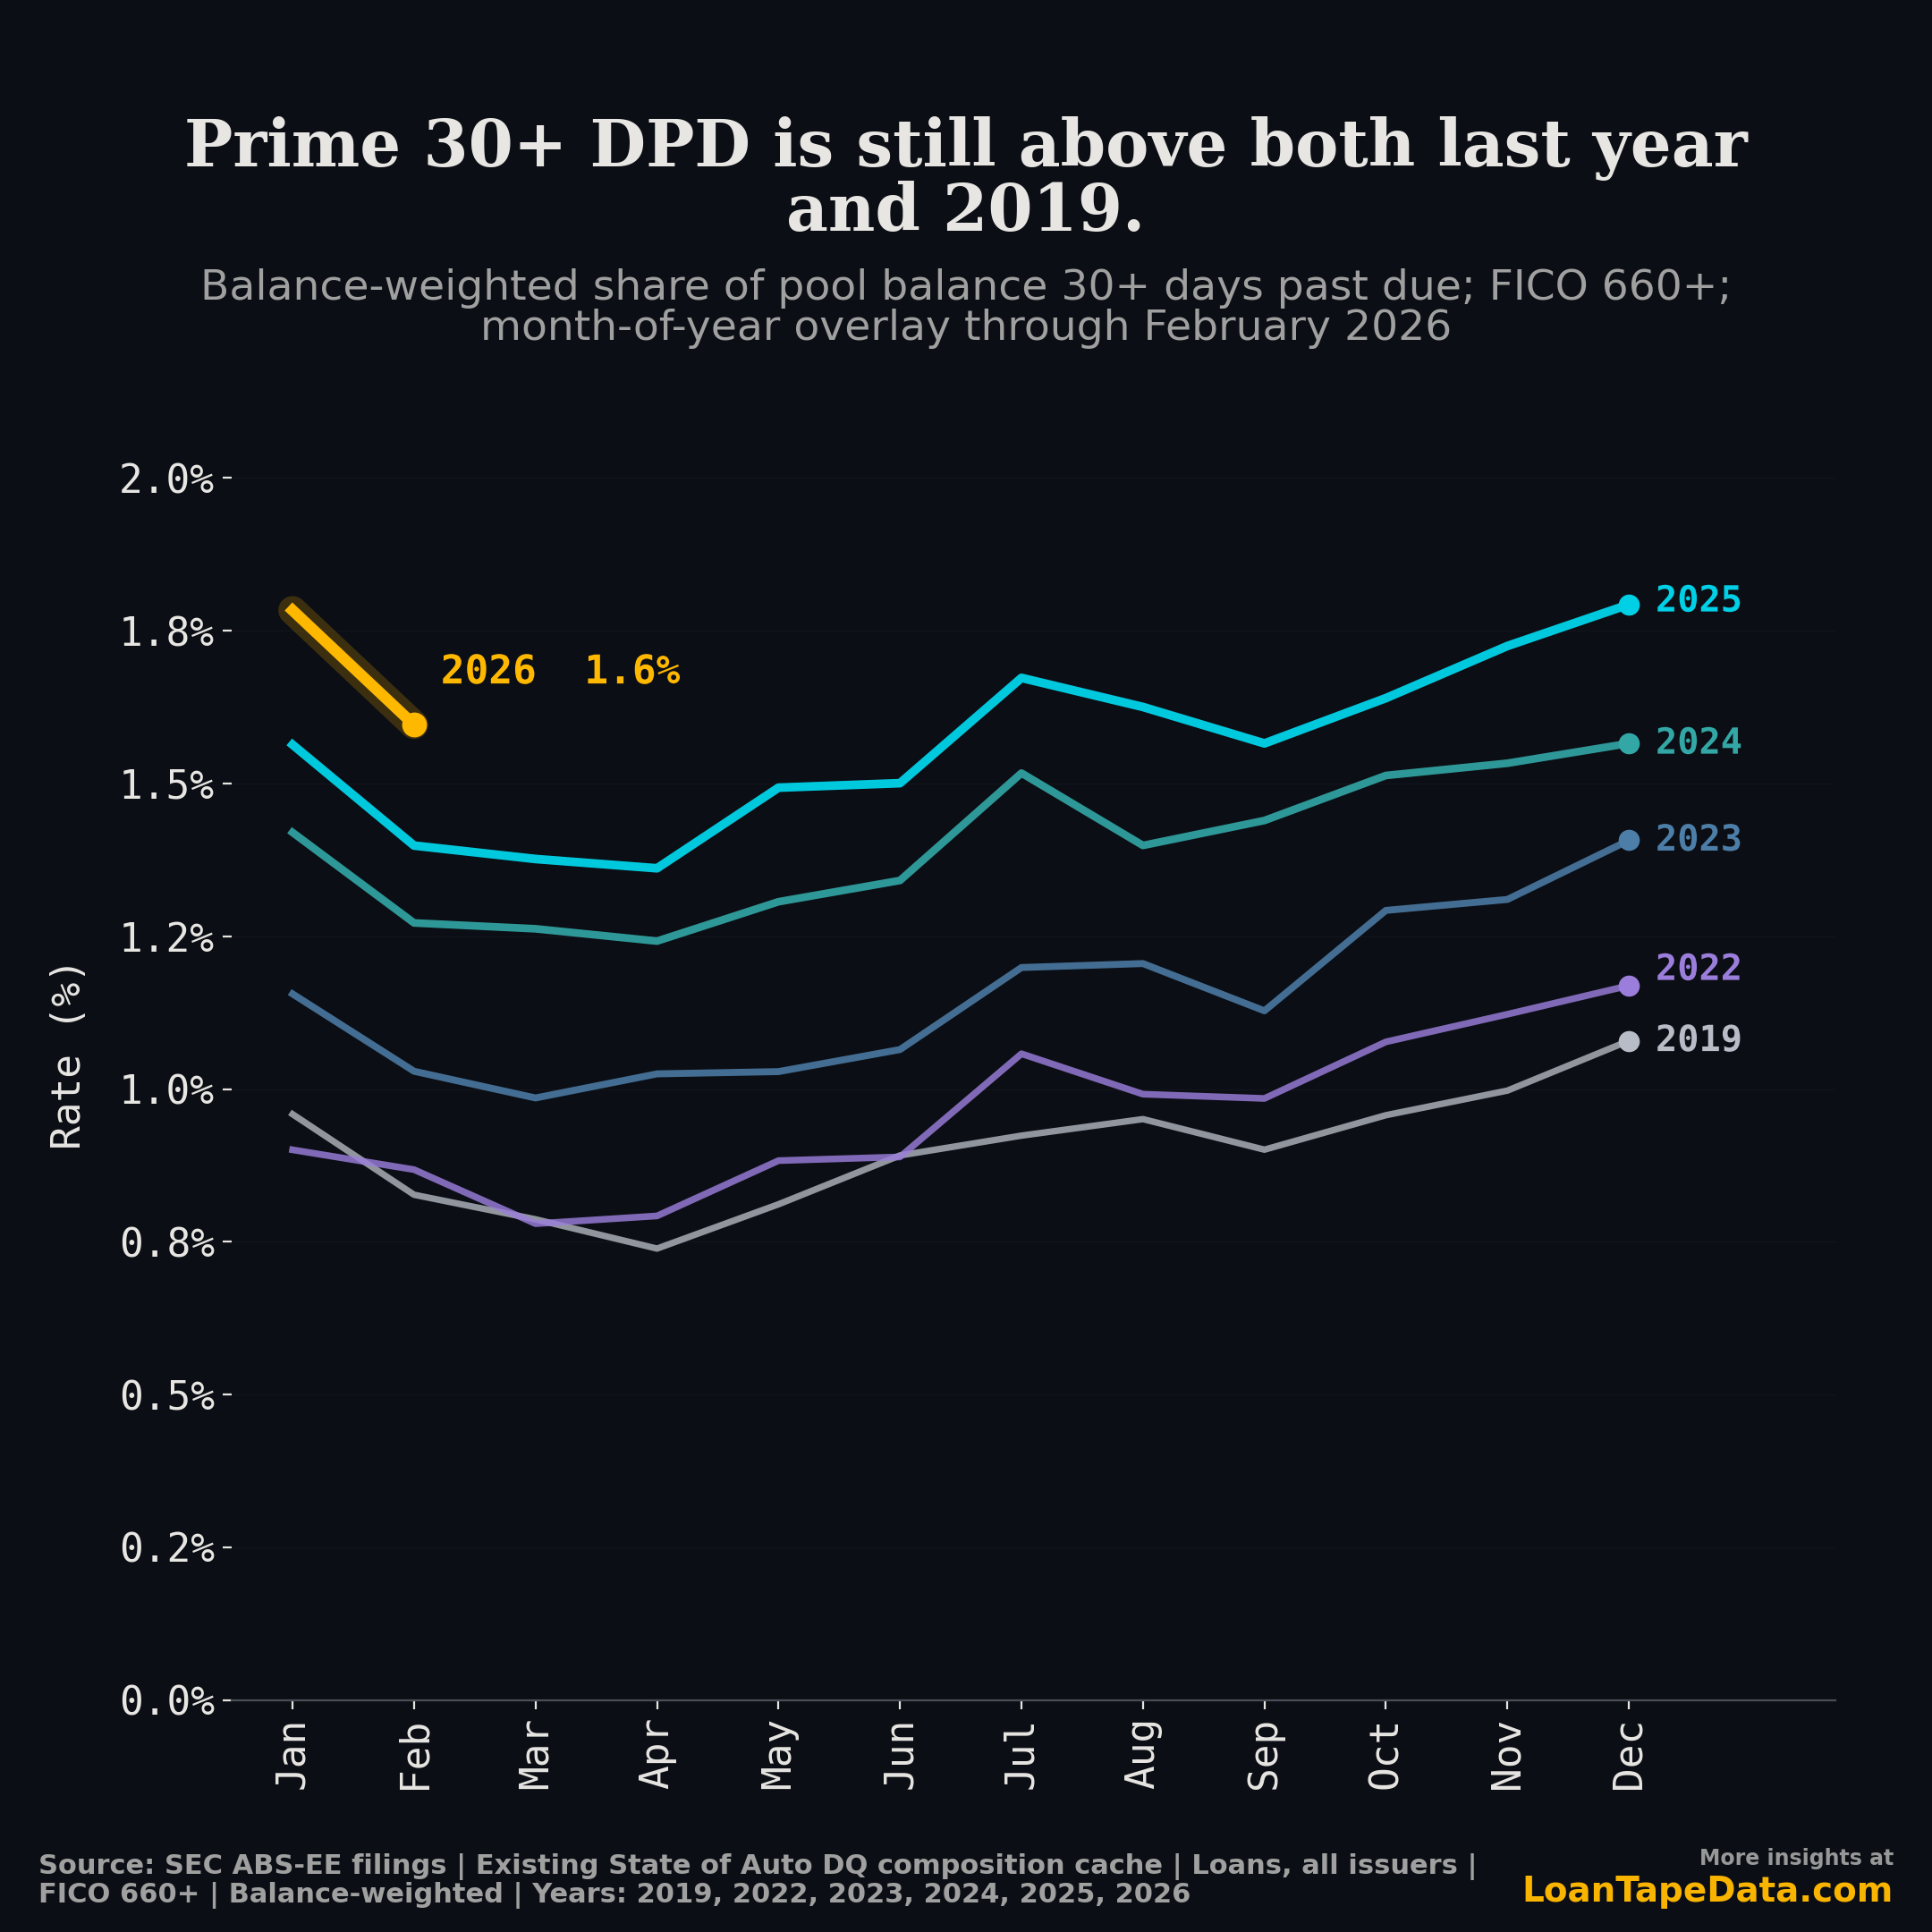
Prime Auto 30+ DPD: Each Year Is the New Floor
Prime auto ABS 30+ day DPD ran 1.60% in February 2026. The same month in 2019, at the same FICO cutoff, was 0.83%.
Roughly double, on prime. That is the part most people treat as the safe slice of the auto book.
I pooled every issuer in the SEC ABS-EE files, weighted by pool balance, FICO 660+ at origination, and laid every January-through-December on the same axis. The pattern is not a one-off shock. It is the same calendar reprinting at a higher level every year.
What the overlay actually shows
A normal year-over-year chart compares one month against the same month a year prior. Useful, but it hides the shape. Putting every year on a shared January-to-December axis lets you see the seasonal swing and the year-on-year drift in the same picture.
Prime 30+ DPD seasonality is clean and repeats every year. January is the local high. Holiday spending lands on auto payments in the first reporting month, and pools enter the year with extra slack. February is the local low because tax refunds cure early-stage delinquency in a hurry. After that the curve ramps into a July summer peak, gives back a little of it in August, then grinds toward a year-end high.
Every year on the chart traces that same shape. Only the level moves, and it only moves one way.
| Same-month 30+ DPD (prime, balance-weighted) | Feb |
|---|---|
| 2019 | 0.83% |
| 2023 | 1.03% |
| 2024 | 1.27% |
| 2025 | 1.40% |
| 2026 | 1.60% |
From 2025 to 2026 the February reading rose 20 basis points. Against 2019, prime is up 77 basis points at the same point in the calendar.
For context, that 77bp gap is bigger than the entire range of 2019's monthly readings. The whole pre-COVID seasonal swing now fits inside the year-over-year drift.
January 2026 was even louder than February
The deeper number on the chart is the January 2026 print at 1.78%, before the February tax-refund cool-down took it down to 1.60%. It is the highest January reading we have on record for prime, including the 2024 and 2025 vintages that came of age during the inflation reset.
Two things are stacking inside that number.
The seasonal cure is doing less work. February still drops, but it drops from a higher peak to a higher trough. More loans enter January in worse shape, so even a normal-sized refund cure leaves the floor higher than the year before. People keep talking about tax refunds like they are a leading indicator on the auto book. They are not. They are a recurring drain valve on a tank that fills a little faster every year.
Late-stage roll keeps creeping up too. Prime 60+ DPD was 0.53% in February 2026 versus 0.24% in February 2019, a 2.26x increase. The ratio of 60+ to 30+ in February 2026 was 0.33, versus 0.28 in February 2019. The entry rate into 30+ is rising and the roll from 30 to 60 is rising at the same time, which is why the floor keeps moving on us.
Why prime, of all things, is the story
Subprime is the easy thing to point at when delinquency rises. Subprime 30+ DPD was 15.57% in February 2026 versus 9.52% in February 2019, and the absolute level is much louder. But subprime DQ has always been volatile and the borrower base has shifted heavily over the last few years (see the post-COVID subprime affordability reset for the longer version).
Prime is supposed to be the steady part. FICO 660+ is the slice that supports senior tranches and the assumed credit floor for most issuer comps. When the floor walks higher every February for five years in a row, a few things are happening at once.
The 2022-2023 vintages are mature now. They were originated at the worst of used-car prices, with the highest financed amounts in the dataset. Those loans are still in the book and they are aging through prime DPD rather than curing out.
Loan terms keep stretching. Longer terms keep equity lower for longer, which is a roundabout way of saying borrowers spend more months underwater on prime collateral than they used to. When stress hits, there is less cushion to skip a payment without rolling delinquent.
Prime is also not as homogeneous as a single FICO cutoff suggests. 660 is not 720. The growth of 660-700 issuance over the last few years has thickened the lower edge of the prime bucket, and that lower edge behaves differently than the senior captive pool data most readers grew up on. Some of the headline drift is composition, not borrower behavior.
A 1.60% February print is still an order of magnitude below subprime, and it does not signal a credit crisis. What it does say is that the ratchet has not stopped. The 2026 line is tracking 2025 plus 20 basis points, on a five-year trail of the same.
What to watch the rest of 2026
The chart gives you the calendar to read against. A few prime waypoints worth comparing 2026 prints to:
| Month | 2025 (prime 30+ DPD) | What 2026 needs to do to break the trend |
|---|---|---|
| March | 1.38% | Print under 1.55% to show stabilization |
| May | 1.49% | Print under 1.65% |
| July (summer peak) | 1.67% | Print under 1.85% |
| December (year-end peak) | 1.79% | Print under 2.00% |
If 2026 holds the 20bp gap above 2025, year-end lands near 2.00% prime 30+ DPD. The dataset has never recorded that level.
A few signals that would change the path:
- A 2026 vintage priced for the new payment math. Lenders that tightened on 2026 originations will not show meaningful DPD until late in the year, but mix shift inside monthly originations is already visible in the loan-level data.
- Term length pulling back. Average term has been a one-way ratchet up. Even a couple-month reversal would change the equity trajectory on the marginal prime loan.
- A real February. Not just a smaller drop, but a drop that takes the prime line back below 2025 at the same point on the calendar. That has not happened in seven years on this overlay.
I will keep posting the YoY overlay each month as new ABS-EE filings land. The seasonal pattern is one of the cleaner things in the auto credit data, which is exactly why the drift in level is hard to argue with.
For the loan-level view behind this chart, the ABS-EE dataset covers 9.5M+ loans across every public auto issuer, and the State of Auto deck ships these overlays each month for prime, below-prime, modifications, repossessions, charge-offs, and cash collected. Subscription tiers are on the pricing page.
Methodology
- Source: SEC ABS-EE filings parsed into LoanTape's loan-level cache. The DQ composition table is the bond-active book-of-business view, weighted by pool balance.
- Cohort: prime is FICO 660+ at origination, pooled across all issuers, with each issuer weighted by pool balance share.
- Metric: 30+ days past due as a share of pool balance, including 60+ and charged-off-but-not-yet-removed where the servicer reports it that way.
- Years on the chart: 2019 (pre-COVID baseline), 2023, 2024, 2025, and 2026 through February. 2020-2022 are excluded to avoid the COVID forbearance distortion in the early-pandemic comparisons.
- Report-month cap: 2026-02, which matches the latest finalized State of Auto build.
- Build version:
20260422_v4_cash_fallback_repo_first_time_beginning_active.