Below-prime auto loans originated in 2023 through 2025 charged off 4.8% of their original balance within 12 months. Loans originated in 2017 through 2019 charged off 3.9%. Over the same period, the share of below-prime balance financed above 120% loan-to-value (LTV) went from 24.8% to 37.3%.
A question I was asked this week: how much of that rise in defaults comes from high-LTV collateral? I split the loan-level ABS-EE data two ways to answer it, first by LTV band and then by lender within each band. The short answer is that the rise is concentrated in loans above 120% LTV, but at any given LTV the lender that made the loan matters about as much as the LTV itself.
The rise is concentrated above 120% LTV
The sample is every securitized auto loan with a credit score of 300 to 660 that I could follow from within six months of origination through month 12: 1.93 million loans ($41.8 billion) from 2017-19 vintages and 1.82 million loans ($47.2 billion) from 2023-25 vintages. Default here means the loan charged off within 12 months of origination, measured as a share of original balance.
I used six LTV bands chosen so every band holds at least 9% of loans in both periods. Before 2023 less than 1% of below-prime loans were financed above 140% LTV, too few to compare.
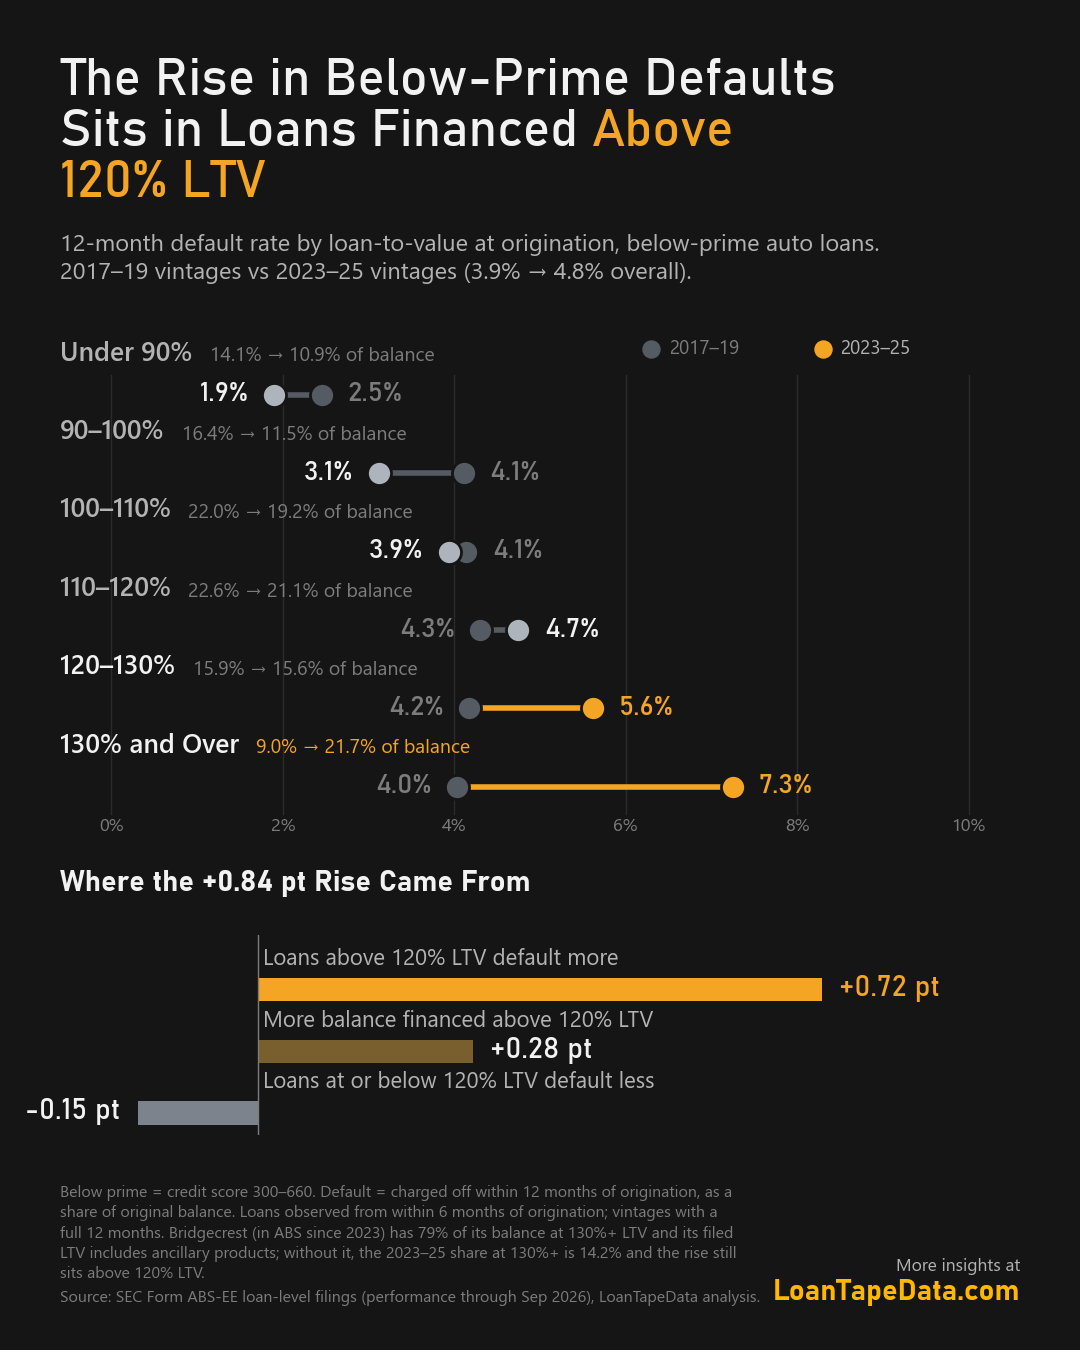
| LTV at origination | Share of balance 2017-19 | Share 2023-25 | 12-mo default 2017-19 | 12-mo default 2023-25 |
|---|---|---|---|---|
| Under 90% | 14.1% | 10.9% | 2.5% | 1.9% |
| 90-100% | 16.4% | 11.5% | 4.1% | 3.1% |
| 100-110% | 22.0% | 19.2% | 4.1% | 3.9% |
| 110-120% | 22.6% | 21.1% | 4.3% | 4.7% |
| 120-130% | 15.9% | 15.6% | 4.2% | 5.6% |
| 130% and over | 9.0% | 21.7% | 4.0% | 7.3% |
Two things changed. More balance moved into the top band, and loans in the top two bands charged off at higher rates than the same bands did in 2017-19. Below 110% LTV, recent loans charged off less than their 2017-19 counterparts.
A standard shift-share split of the 0.84-point rise:
- loans above 120% LTV charging off at higher rates: +0.72 points
- more balance financed above 120% LTV: +0.28 points
- loans at or below 120% LTV, net: -0.15 points
On that view, all of the rise sits in loans above 120% LTV. That is where the analysis usually stops. It leaves out who made the loans.
One lender holds most of the top band
The 130%-and-over band in 2023-25 is not a cross-section of the market. Bridgecrest, the Carvana-affiliated servicer whose trusts began filing ABS-EE tapes in 2023, holds 42.1% of the balance in that band and 54.0% of its 12-month defaults. Bridgecrest is 11.6% of all 2023-25 below-prime balance in the sample, and 79% of its own balance is at 130% LTV or higher.
Part of that is likely definitional. Bridgecrest's offering documents report pool LTV both including and excluding ancillary products financed with the car (Bridgecrest Auto Funding 424B5), and the loan-level LTVs in its ABS-EE tapes (median about 148%) sit well above the pool figure excluding those products. Other lenders' filed LTVs are not all on that basis. Two loans with the same car and the same advance can land in different bands depending on who filed them.
Without Bridgecrest, the 130%-and-over band charged off 5.8% in 2023-25 rather than 7.3%, and its share of balance went from 9.0% to 14.2% rather than to 21.7%. The rise in 12-month defaults outside Bridgecrest is smaller, 3.9% to 4.2%, but it still comes entirely from loans above 120% LTV (+0.40 points from higher default rates in those bands, +0.10 points from more balance there, -0.21 points from the bands below).
At the same LTV, lenders sit far apart
The cleaner test is to hold the lender fixed and move LTV, then hold LTV fixed and move the lender.
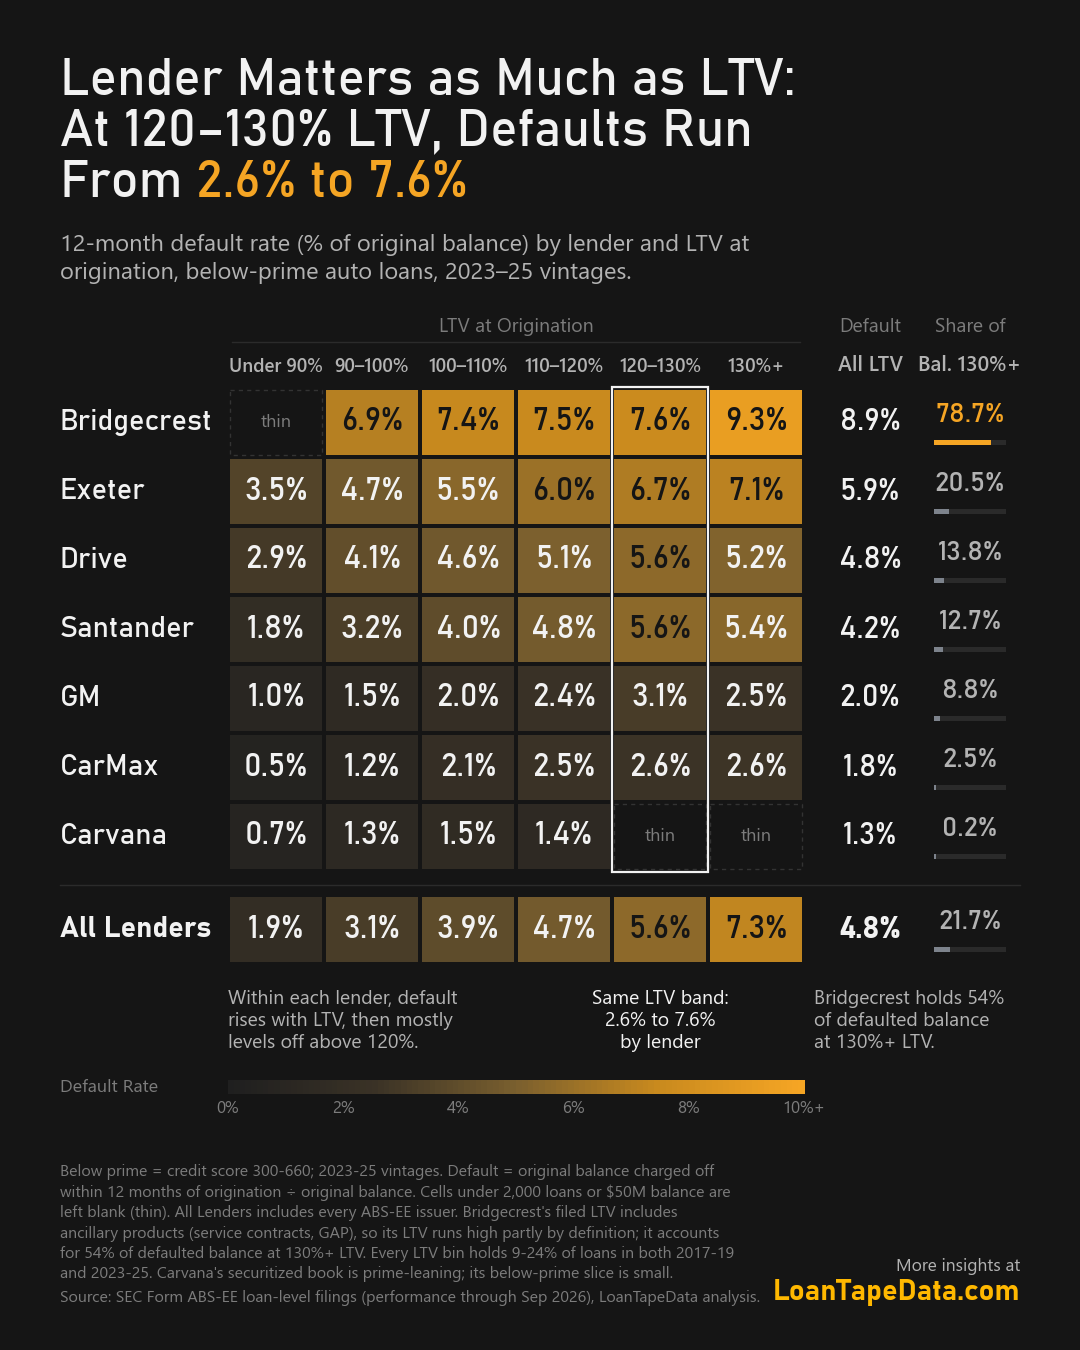
| Lender | Under 90% | 90-100% | 100-110% | 110-120% | 120-130% | 130%+ |
|---|---|---|---|---|---|---|
| Bridgecrest | thin | 6.9% | 7.4% | 7.5% | 7.6% | 9.3% |
| Exeter | 3.5% | 4.7% | 5.5% | 6.0% | 6.7% | 7.1% |
| Drive | 2.9% | 4.1% | 4.6% | 5.1% | 5.6% | 5.2% |
| Santander | 1.8% | 3.2% | 4.0% | 4.8% | 5.6% | 5.4% |
| GM | 1.0% | 1.5% | 2.0% | 2.4% | 3.1% | 2.5% |
| CarMax | 0.5% | 1.2% | 2.1% | 2.5% | 2.6% | 2.6% |
12-month default rate, share of original balance, 2023-25 vintages. "Thin" is a cell under 2,000 loans.
Reading across a row, LTV matters inside every lender. From under 90% to 120-130% LTV, defaults rise by 2.1 to 3.8 points depending on the lender, a median of about 2.7 points. For most lenders the rate then levels off; Drive, Santander and GM are lower at 130%+ than at 120-130%, and CarMax is flat.
Reading down a column, the spread between lenders is as large or larger. At 120-130% LTV, 12-month defaults run from 2.6% at CarMax to 7.6% at Bridgecrest. At 100-110% the range is 2.0% at GM to 7.4% at Bridgecrest. Bridgecrest's 90-100% loans charged off at a higher rate than any other lender's loans in any band except Exeter's 130%+.
Leaving Bridgecrest out does not close the gap. At 120-130% LTV, Exeter at 6.7% and CarMax at 2.6% are 4.1 points apart, more than the median 2.7-point rise from moving one lender's loans from under 90% to 120-130% LTV.
I also checked this with LTV ranked within each lender, splitting each lender's loans into five equal groups by its own filed LTV so that different LTV conventions do not matter. The pattern holds: each lender's highest-LTV fifth charges off 1.8 to 3.5 points more than its lowest-LTV fifth, while the lenders' lowest-LTV fifths alone range from 0.5% (CarMax) to 7.4% (Bridgecrest).
What "lender" stands for here
The lender column bundles everything that differs between books: where each lender sits within the 300-660 score range, term, payment-to-income (PTI), vehicle age, pricing, servicing and collections. This data does not separate those. A lender with a lower average score inside the below-prime band will show higher defaults at every LTV for that reason alone. What the table does establish is narrower: knowing a loan's LTV band without knowing who made it leaves a large share of the variation in 12-month defaults unexplained.
It also changes how the aggregate trend reads. The headline below-prime LTV distribution moved partly because a new issuer with a high-LTV book and a different LTV convention entered the securitization market in 2023. Within the lenders present in both periods, the shift toward higher LTV is smaller, and the higher default rates at high LTV are smaller too.
What I would watch
- The 120-130% band within each lender. That is where the within-lender rise is steepest before it levels off, and where 2023-25 defaults are furthest above 2017-19 for the large incumbent lenders.
- Lender mix in new trusts. A shift in which shelves issue below-prime paper moves the aggregate LTV and default figures without any change in underwriting at a given lender. Our issuer and trust pages break out every trust's collateral mix month by month.
- LTV conventions. Before comparing LTV across issuers, check what goes into the amount financed. The Form 10-D data and offering documents are where each issuer states it.
Method
Source: SEC Form ABS-EE loan-level filings, performance through September 2026, every auto loan trust that files loan-level data (leases excluded). Below prime means an obligor credit score of 300 to 660 at origination. LTV is the filed loan-to-value ratio at origination; loans with no LTV or an LTV of 300% or more are excluded. A loan is included if its first tape came within six months of origination and it had at least 12 months to run by the September 2026 data, so a loan that paid off early stays in the denominator. Default means charged off within 12 months of origination; rates are original balance charged off divided by original balance. The shift-share split uses the average of the two periods' weights and rates, so the parts add to the total. The figures describe what the filings show and do not isolate the effect of LTV from other borrower and lender differences.
The loan-level files behind these tables, with LTV, score and charge-off timing for every loan, are part of the LoanTapeData subscription.