Longer auto loan terms helped prime and hurt subprime
Half a point up in prime, a point and a half down in subprime
For auto loans originated from 2017 to 2019, prime loans written with an extra year of term returned about half a point more per year on their balance, after losses, than the same lender's shorter-term loans in the same FICO band. Below a FICO of 600, an extra year of term came with about a point and a half less.
I measured that on roughly 5 million loans in the public ABS-EE record, comparing loans only against other loans from the same lender, in the same FICO band and the same origination year. The term did little to how long a pool lasted. It did change how much cash the pool returned, and a loss table by term gives the wrong read on which terms did well.
A longer term does not make the pool last much longer
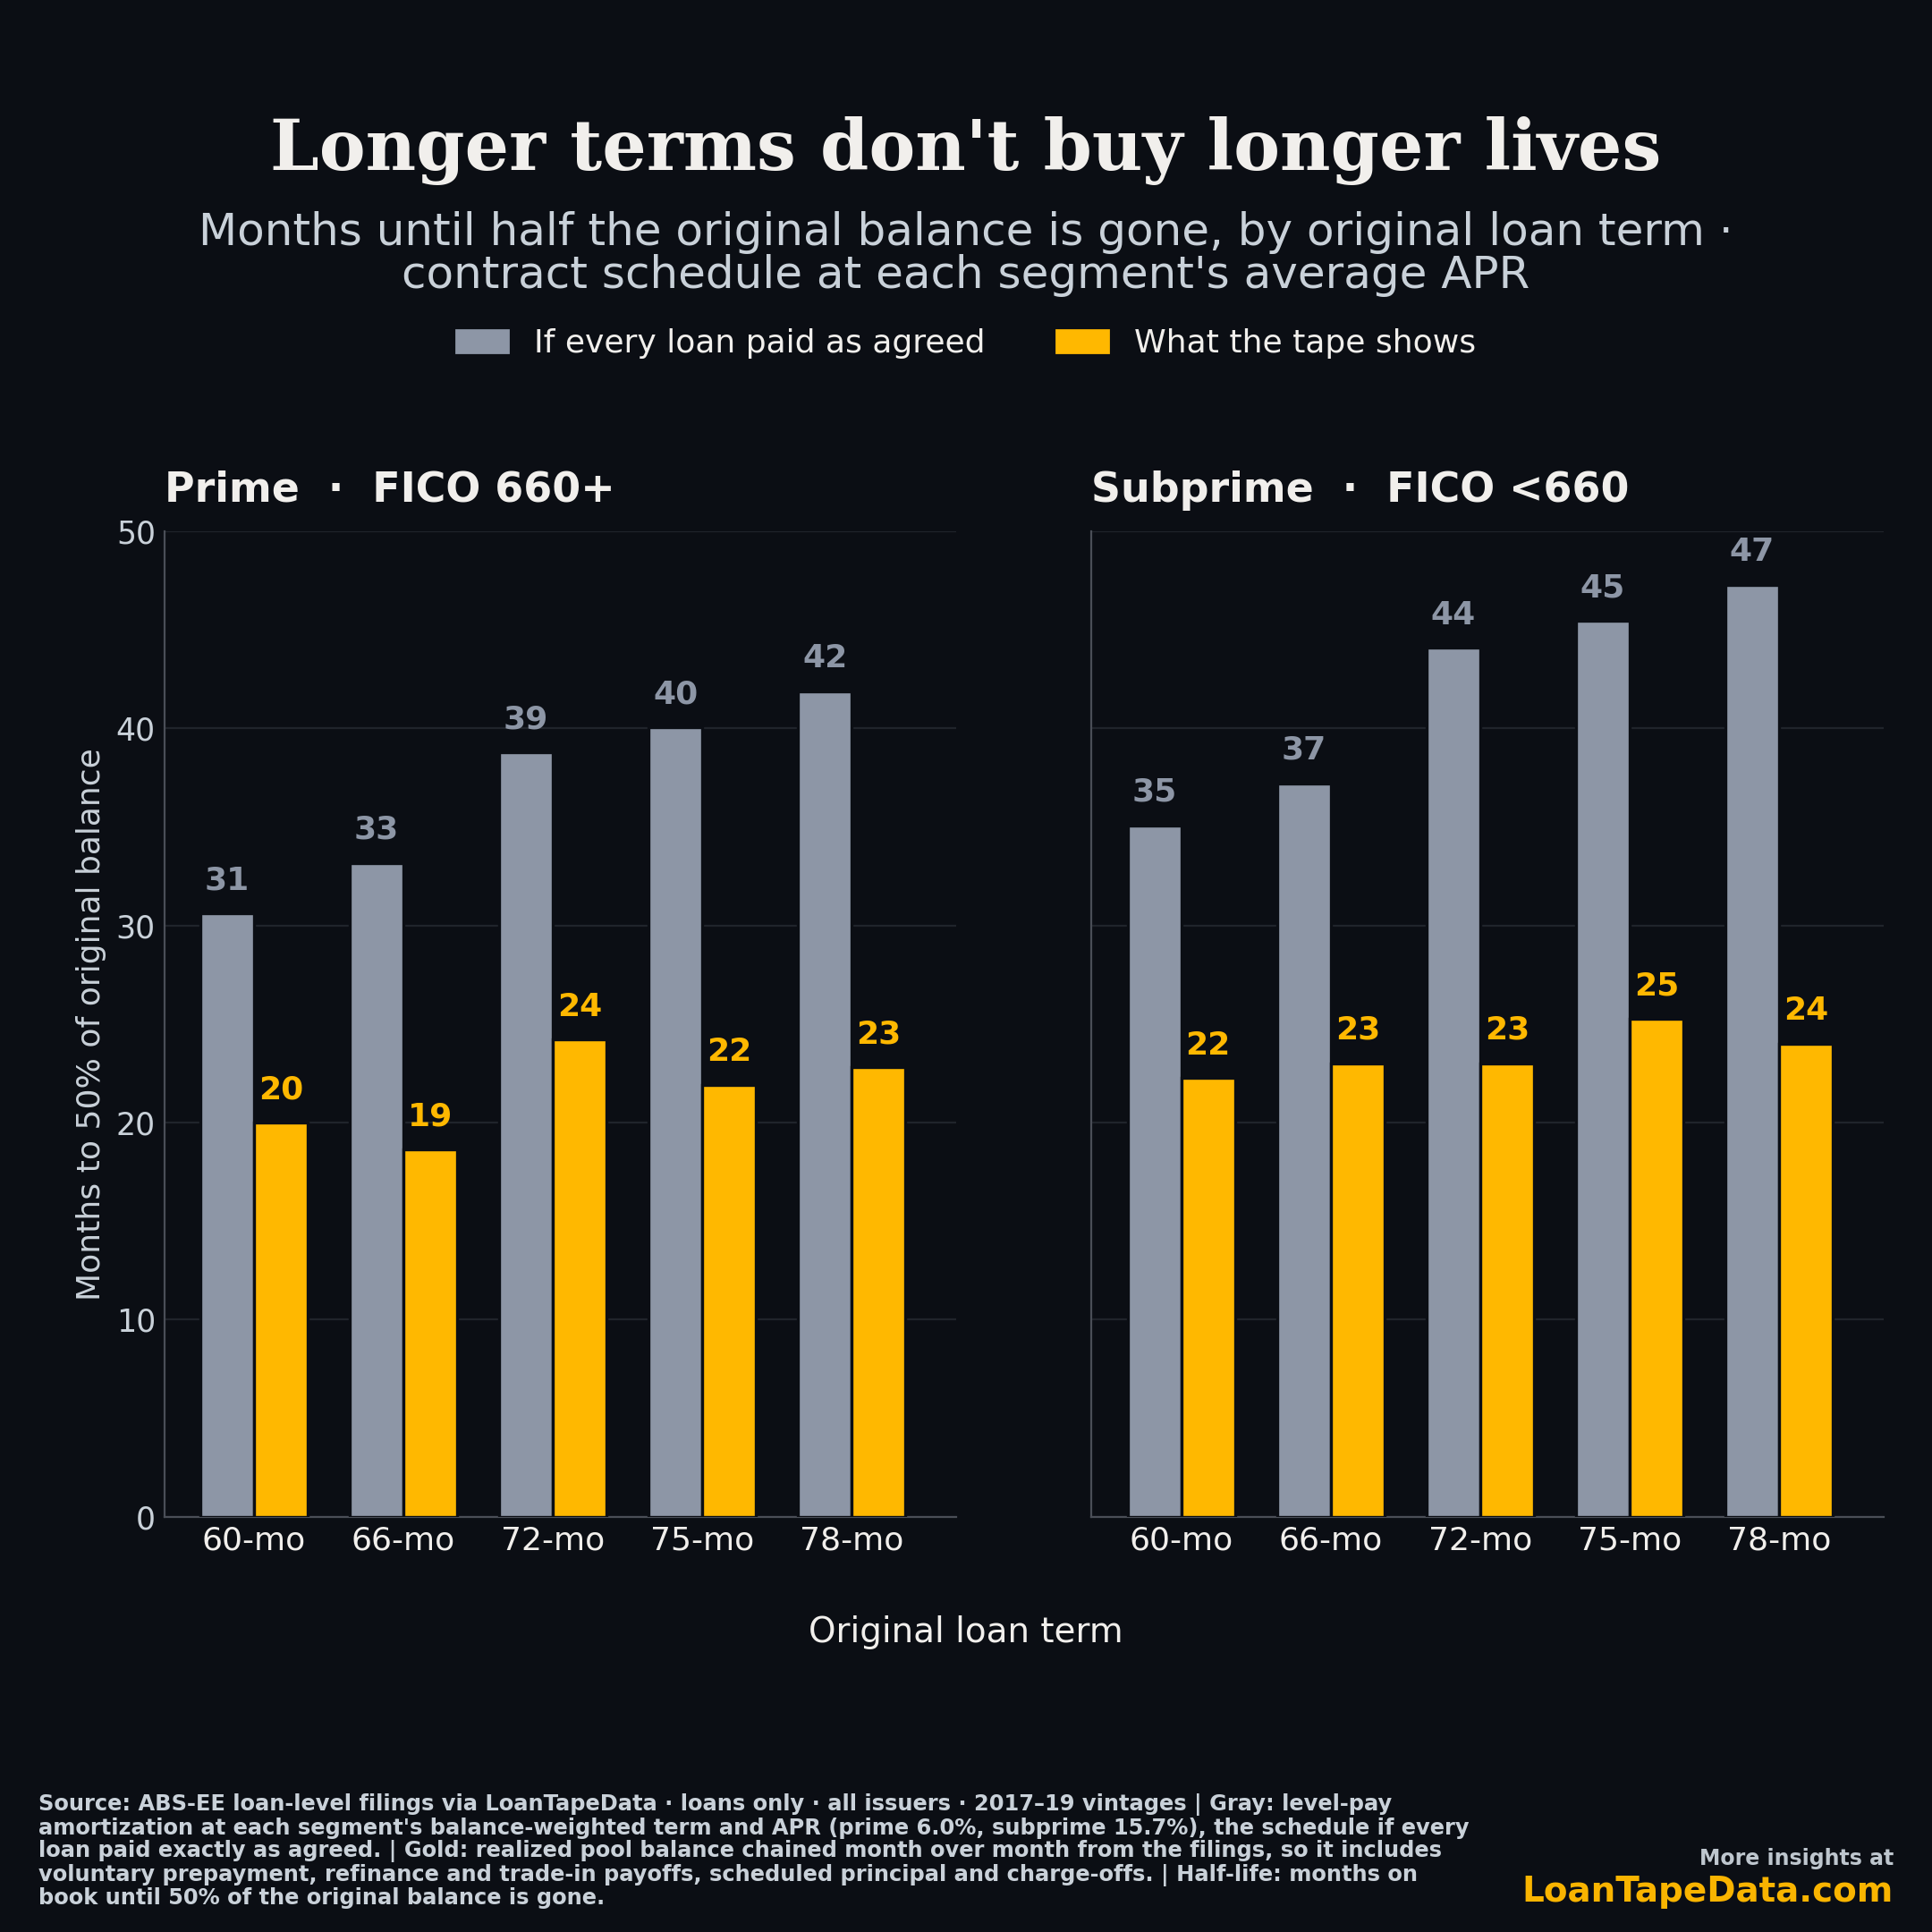
Start with the schedule. On a level-pay amortization at a 6% rate, a pool of 60-month prime loans has half its original balance paid down by month 31. A 78-month pool takes until month 42. Eleven more months of life, on paper.
The tapes disagree. I chained each pool's balance month over month from the monthly servicing filings, which captures prepayment, trade-ins, refinancing and charge-offs as they happen, and read off the month the balance fell below half.
| Original term | Prime, schedule | Prime, realized | Subprime, schedule | Subprime, realized |
|---|---|---|---|---|
| 60 months | 31 | 20 | 35 | 22 |
| 66 months | 33 | 19 | 37 | 23 |
| 72 months | 39 | 24 | 44 | 23 |
| 75 months | 40 | 22 | 45 | 25 |
| 78 months | 42 | 23 | 47 | 24 |
Months until half the original balance is gone, 2017 to 2019 vintages. Prime is a FICO of 660 or above at origination. The schedule column uses each segment's balance-weighted annual percentage rate (APR), 6.0% in prime and 15.7% in subprime.
Every term from 60 to 78 months reached the halfway point between month 19 and month 25. The monthly prepayment rate is roughly the same across terms, 1.3% to 2.1% of the surviving balance, so the extra scheduled months at the end of a long contract are months that most loans never reach.
The loss table points the wrong way
The usual first check is charge-offs by term. On that measure the 72-month bucket looks worst in seven of eight FICO bands. Per $100 of balance still outstanding at month 12, the share that later charged off:
| Term | Prime | Subprime |
|---|---|---|
| 60 months | 0.8 | 17.6 |
| 72 months | 5.6 | 25.3 |
| 78 months | 3.6 | 10.2 |
That comparison mixes different lenders. The 72-month bucket in this data is 80% subprime paper at a balance-weighted APR of 16.4%. The 75- and 78-month buckets carry balance-weighted APRs of 9.7% and 7.8%. A loss table by term is largely a table of who writes which term.
A loss table also leaves out interest. The loans that charged off more also paid more of it. Measured as net cash, meaning payments plus recoveries minus principal lost, per $100 of month-12 balance, the longer terms returned more in both tiers:
| Term | Prime net cash | Subprime net cash |
|---|---|---|
| 60 months | +5.2 | +15.0 |
| 72 months | +9.5 | +16.6 |
| 78 months | +10.1 | +17.1 |
That is still a raw comparison, and it credits longer terms for the extra time their balance is outstanding. To compare like with like, I annualized the cash on the average balance outstanding and compared each lender only with itself.
FICO sets the return, term moves it up or down
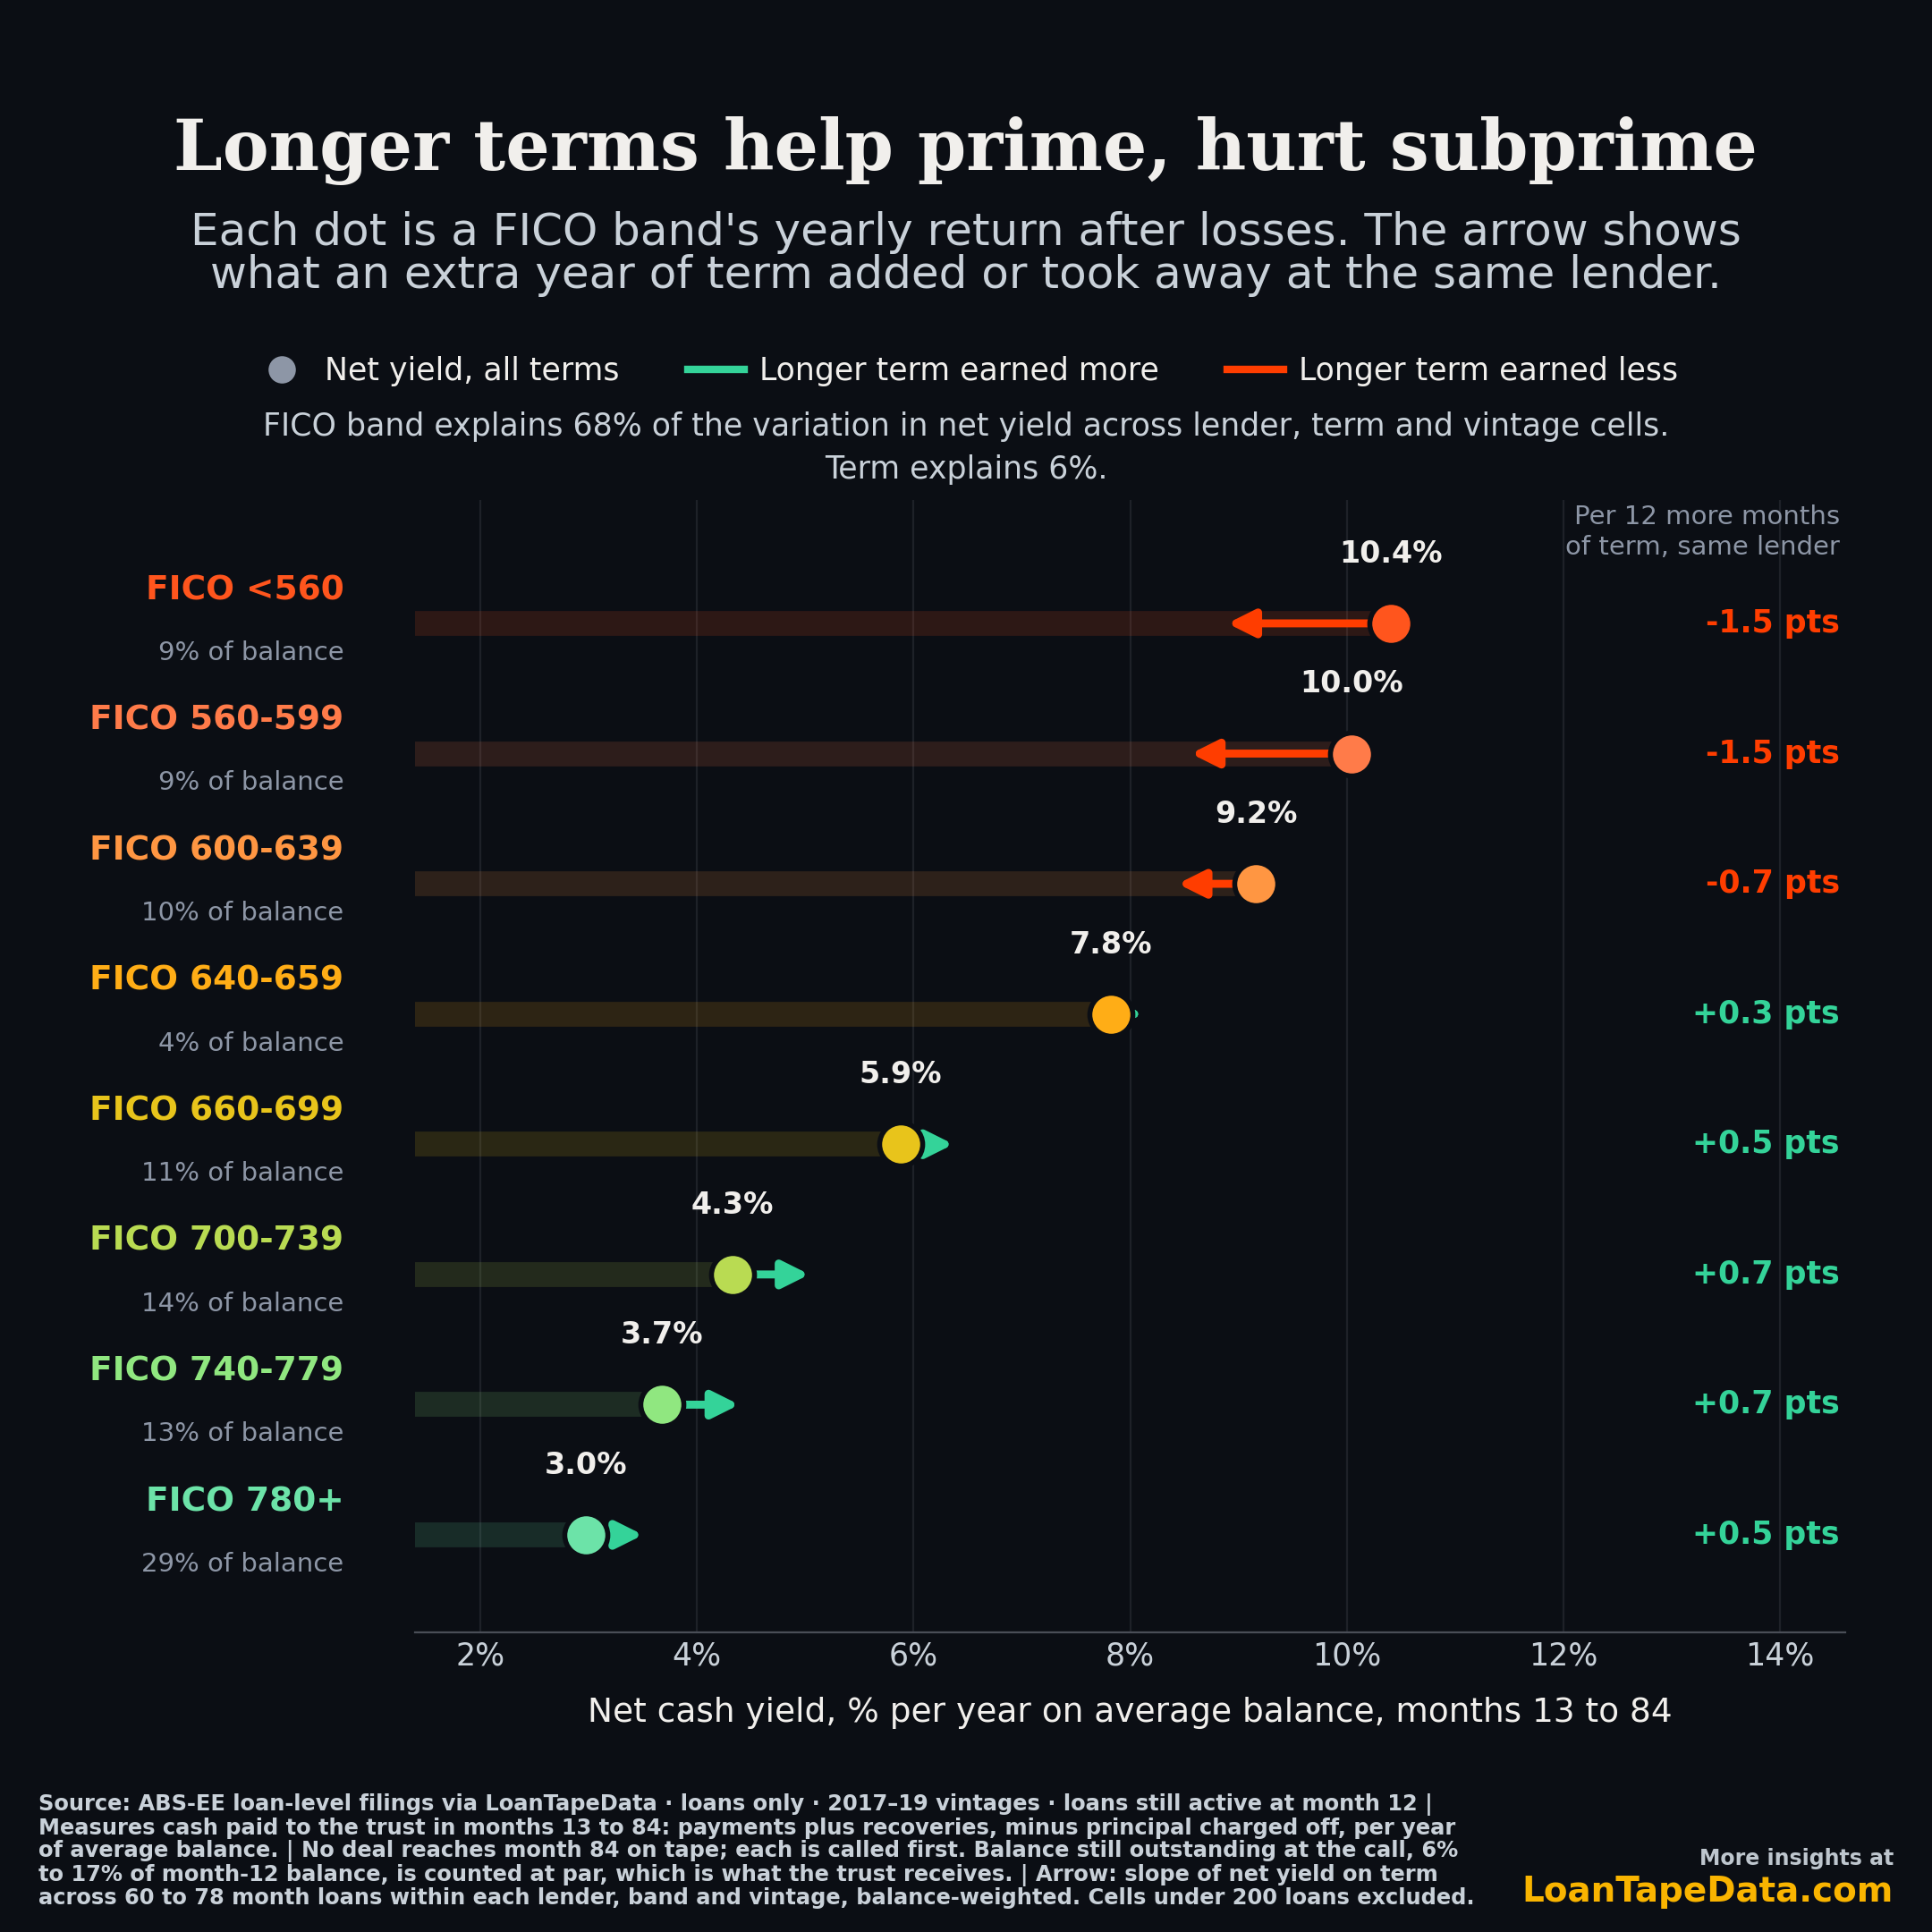
Each dot is a FICO band's net cash yield per year, across all terms. Each arrow is the change for an extra 12 months of term, measured inside the same lender, FICO band and vintage and then averaged, weighted by balance.
| FICO band | Share of balance | Net yield per year | Extra year of term |
|---|---|---|---|
| Below 560 | 9% | 10.4% | −1.5 pts |
| 560 to 599 | 9% | 10.0% | −1.5 pts |
| 600 to 639 | 10% | 9.2% | −0.7 pts |
| 640 to 659 | 4% | 7.8% | +0.3 pts |
| 660 to 699 | 11% | 5.9% | +0.5 pts |
| 700 to 739 | 14% | 4.3% | +0.7 pts |
| 740 to 779 | 13% | 3.7% | +0.7 pts |
| 780 and above | 29% | 3.0% | +0.5 pts |
The FICO step is much larger than the term effect. Across every lender, band, term and vintage cell with at least 200 loans, FICO band explains 68% of the variation in net yield. Term, inside a band, explains 6%. The term effect is small, but its direction is consistent: positive in every band from 640 up, negative in every band below 640.
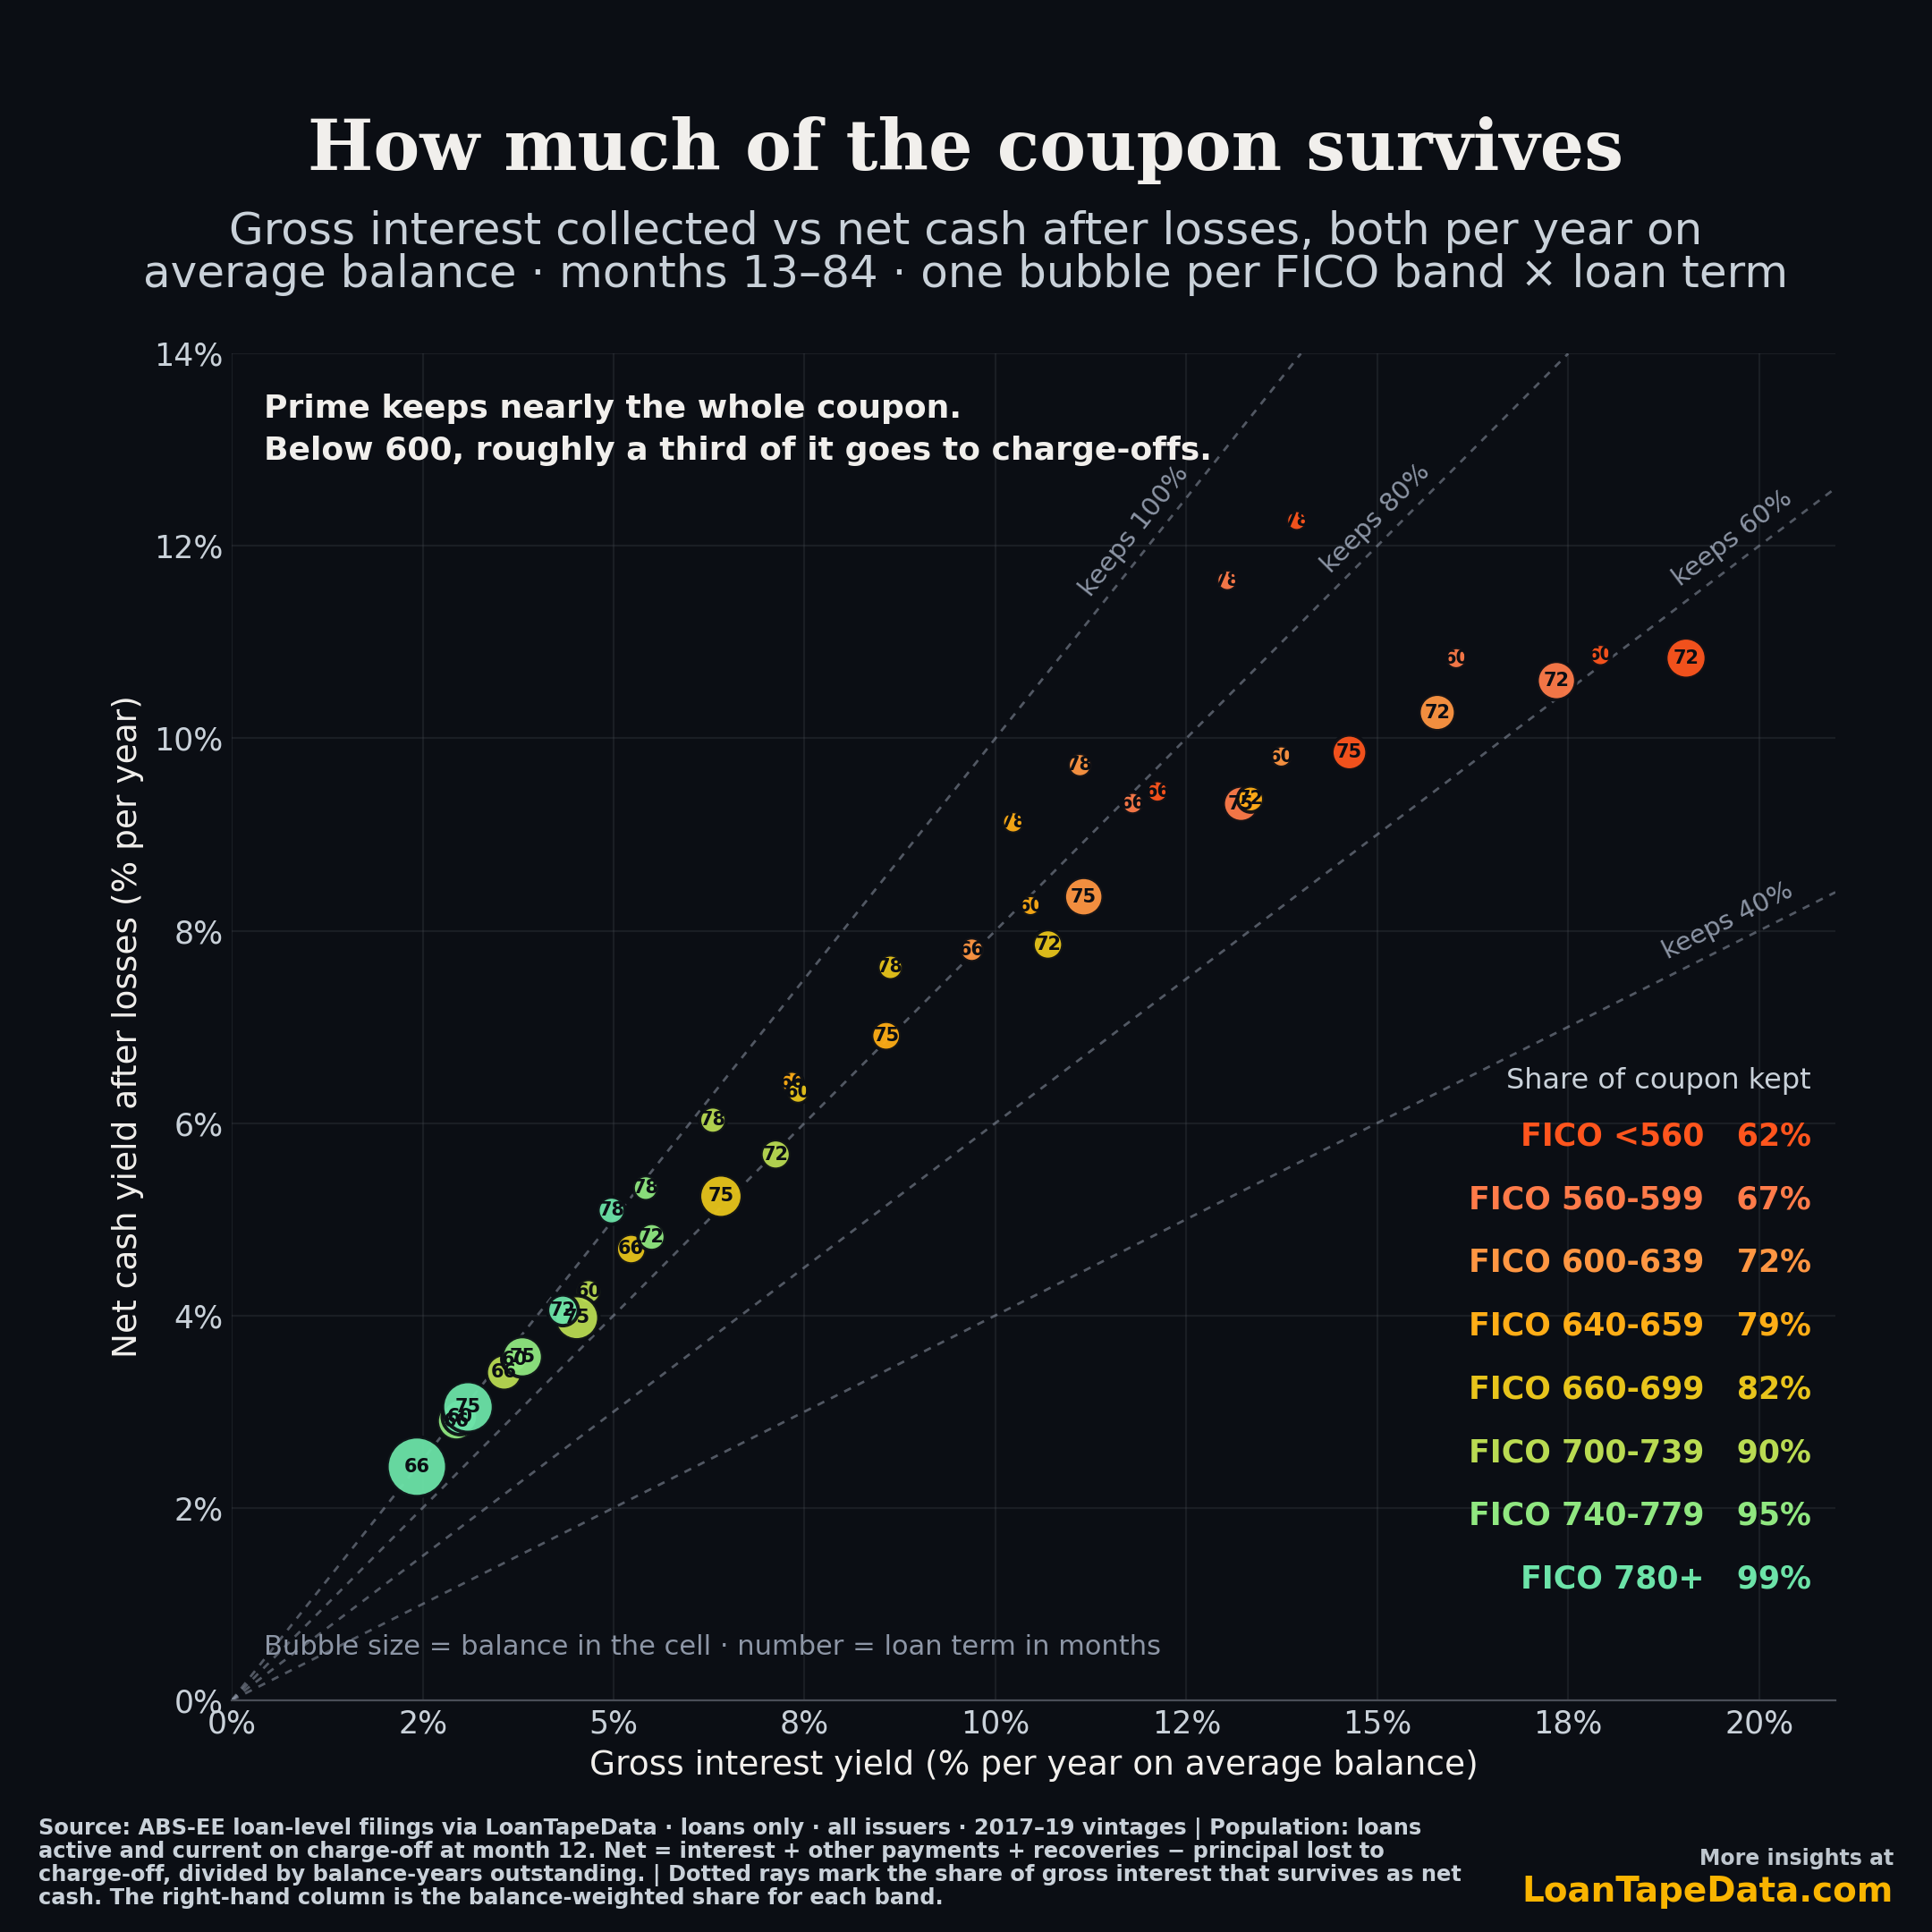
The split lines up with how much of the interest each band keeps. Dividing net yield by gross interest yield gives the share of the coupon left after charge-offs:
| FICO band | Share of interest kept after losses |
|---|---|
| 780 and above | 99% |
| 740 to 779 | 95% |
| 700 to 739 | 90% |
| 660 to 699 | 82% |
| 640 to 659 | 79% |
| 600 to 639 | 72% |
| 560 to 599 | 67% |
| Below 560 | 62% |
In prime, lenders charge a higher rate on longer terms and nearly all of it reaches the trust, so the extra rate shows up as extra yield. Below 600, roughly a third of the interest is already going to charge-offs, and on these vintages the higher rate on a longer term did not cover the higher charge-offs that came with it.
These numbers describe loans that were written at different terms. They do not estimate what lengthening a given loan would do. Term is chosen together with the borrower, the vehicle and the rate. Comparing within lender, band and vintage removes the largest sources of mix, but not all of them.
What I would watch
The subprime rows come mostly from Drive, Santander, GM and CarMax, which between them hold most of the public subprime auto ABS balance written at both 60 months and 72 or more. Their 2021 and 2022 originations are the ones to follow. On those vintages, voluntary prepayment on subprime loans of 75 months or longer has run at 0.6% to 0.9% a month, about half the 2017 to 2019 speed, so more of that balance is staying outstanding. I would re-run this comparison on those vintages once they reach month 48.
The other place term shows up is in payment extensions. An extension pushes a loan's maturity out without changing the original term on the tape, and by March 2026 8.6% of outstanding loans had a payment moved in the prior year against a 5.2% average in 2018 and 2019, as I covered in an earlier post on extension rates. I have not separated extended loans out of this analysis.
Method and data notes
The data is the monthly loan-level tape each auto ABS trust files as an ABS-EE exhibit alongside its Form 10-D. The population is loans, not leases, originated from 2017 to 2019, with a balance outstanding and no charge-off at month 12 on book. Starting at month 12 puts every term on the same footing and avoids the months before a loan enters its trust.
What is measured
For each loan I summed the cash reported in months 13 to 84: total payments collected and recoveries. Loans that charged off contribute nothing after the charge-off. Net cash yield is that cash minus the month-12 balance, divided by the balance-years outstanding over the window, so a loan is not credited for staying on the books longer.
Where the window ends
No deal in this data is still reporting at month 84. Each trust is called by its servicer first, usually when the pool has paid down to around a tenth of its original balance. Any balance still outstanding when a loan leaves the tape without paying off or charging off is counted at par, which is what the trust receives when the deal is called. That residual is 6% of month-12 balance for 60-month loans and 14% to 17% for 72- to 78-month loans. Losses on those loans after the call fall on the servicer, not the trust. As a check, I projected two more years of charge-offs on the residual at each cell's late-life charge-off rate and 55% severity. Above 740 the effect is under 0.1 point a year at every term, and from 660 to 739 it is under 0.3. Below 600 it reaches 1.3 points a year on 72-month loans, which is about the size of the subprime term effect, so the subprime numbers carry more uncertainty than the prime ones.
The term effect
Within each lender, FICO band and vintage, I fit net yield against the balance-weighted term across the 60- to 78-month buckets, requiring at least three buckets with 200 or more loans each spanning at least nine months of term. The slope is reported per 12 months of term and averaged across cells by balance. The variance shares are balance-weighted: FICO band first, then term within band.
What counts as a charge-off
A month counts as a charge-off when the servicer files zero-balance code 4, or when it files charged-off principal and the balance falls to $1 or less. Rows the servicer marks as paid off, with zero-balance code 1 or a paid-in-full date, count as payoffs even if a few dollars of charged-off principal come with them. So do rows where the principal collected covers the drop in balance. Three issuers, GM, Ford and Mercedes-Benz, file token write-offs of about $10 on ordinary payoffs, and without this rule their prime 60-month loans would show 14% of balance charged off instead of under 1%. The net cash figures are the same either way, because the payoff cash is in total payments.
Field notes
Recoveries use the recovered amount each issuer files. Issuers do not report charge-offs on a common basis, which I covered in a separate post on gross and net charge-offs; comparing each lender only with itself removes most of that difference. One issuer, Ally, leaves total payments blank for about 61% of its loans in this sample, so its cash is rebuilt from the principal, interest and other amounts it does report. Realized half-life includes charge-offs, and the realized loss record by vintage is in this earlier post.
The balance curves, cash flows and charge-off detail behind these tables, by lender, term and FICO band, are in the ABS-EE dataset. Plans are on the pricing page.