FICO vs VantageScore: The Lead Flips Near 747
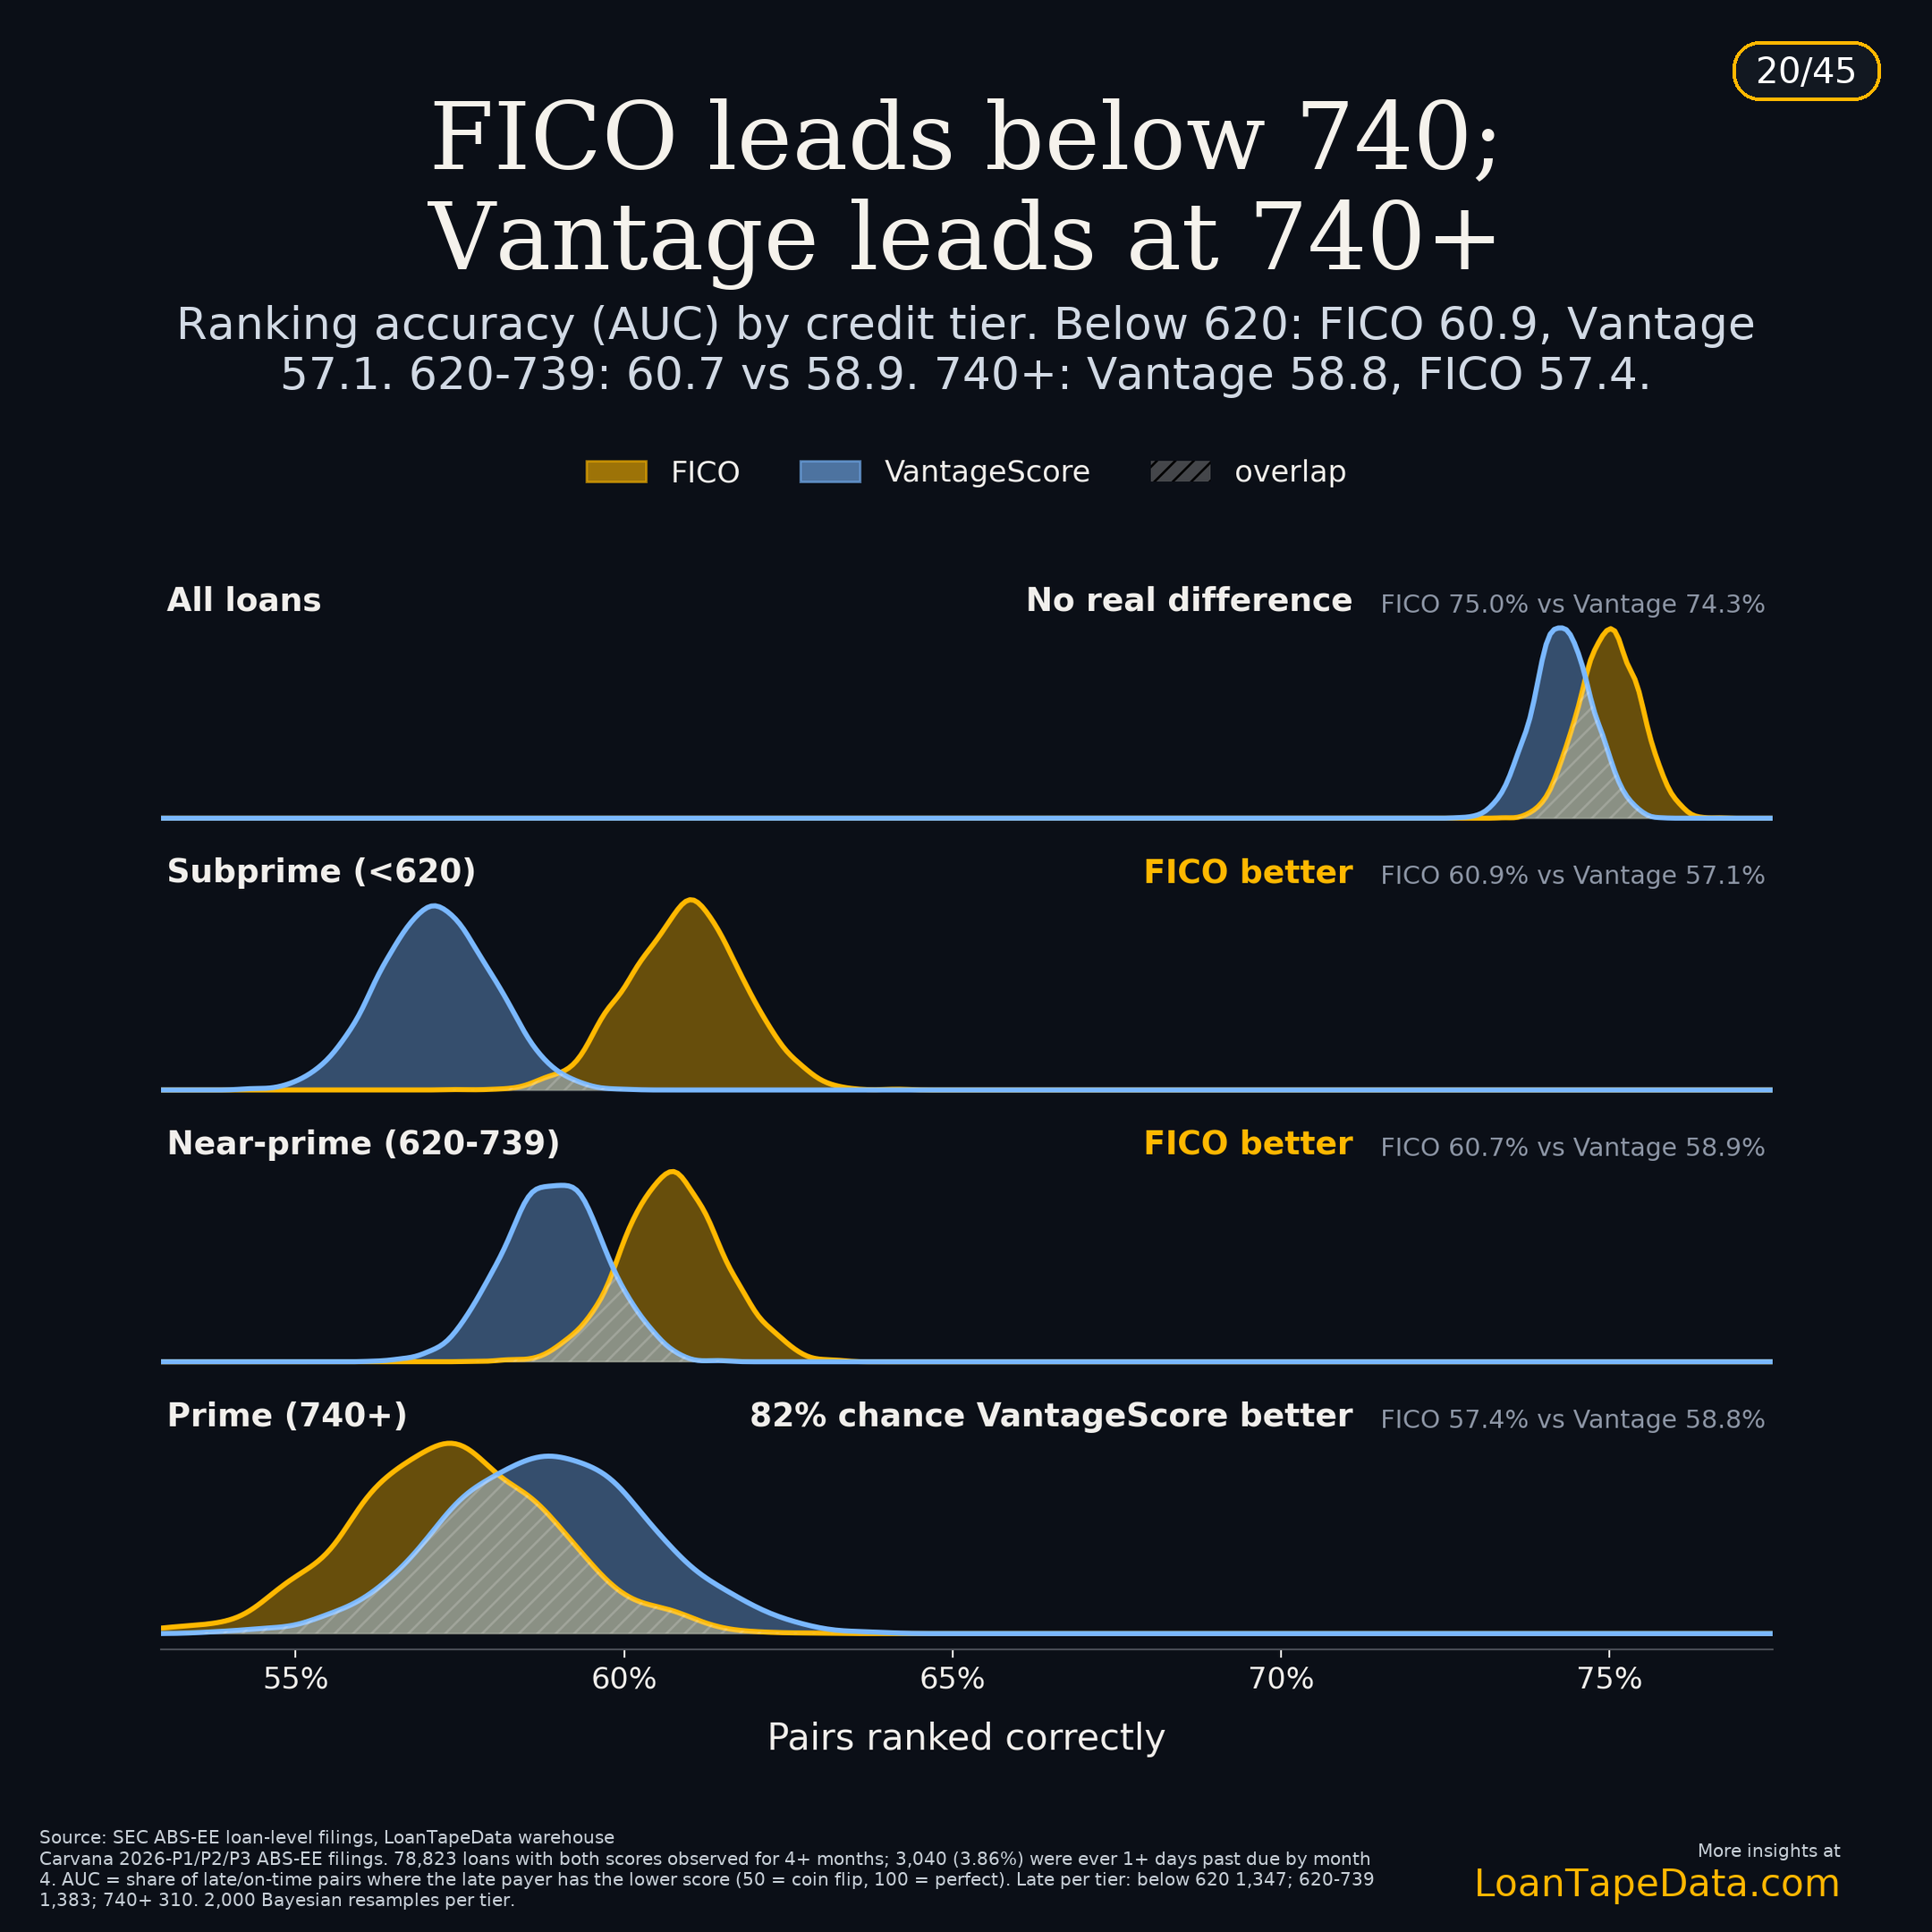
Across 78,823 Carvana auto loans filed with both scores, FICO's AUC is 75.0 and VantageScore's is 74.3. That gap of 0.7 points is too small to matter in most uses. Split the same loans by credit tier and the two scores separate: FICO leads by 3.8 points below 620, and VantageScore leads by 1.4 points at 740 and above.
My October post measured the overall gap and found the two scores close. This post looks at where along the score scale that gap sits, and how much of it holds up month to month.
AUC here is the share of late and on-time borrower pairs in which the late payer has the lower score. 50 is a coin flip and 100 is perfect. Late means ever 1+ days past due (DPD) by month 4.
Tier by tier
Within a tier, AUC falls for both scores because the borrowers are more alike. The comparison that counts is the gap between the two scores inside each row.
| Tier (average of both scores) | Loans | Late | FICO AUC | VantageScore AUC |
|---|---|---|---|---|
| All loans | 78,823 | 3,040 | 75.0 | 74.3 |
| Below 620 | 10,789 | 1,347 | 60.9 | 57.1 |
| 620-739 | 39,621 | 1,383 | 60.7 | 58.9 |
| 740+ | 28,413 | 310 | 57.4 | 58.8 |
The curves show the range of plausible values from 2,000 resamples of the data. Below 620 they barely overlap. At 740+ they overlap heavily: VantageScore is ahead in 82% of resamples, on only 310 late payers.
Where the lead changes hands
Fixed tiers can hide where the change happens, so I also measured the gap inside a sliding 60-point window of average score. Each window is computed on its own borrowers, not cumulatively.
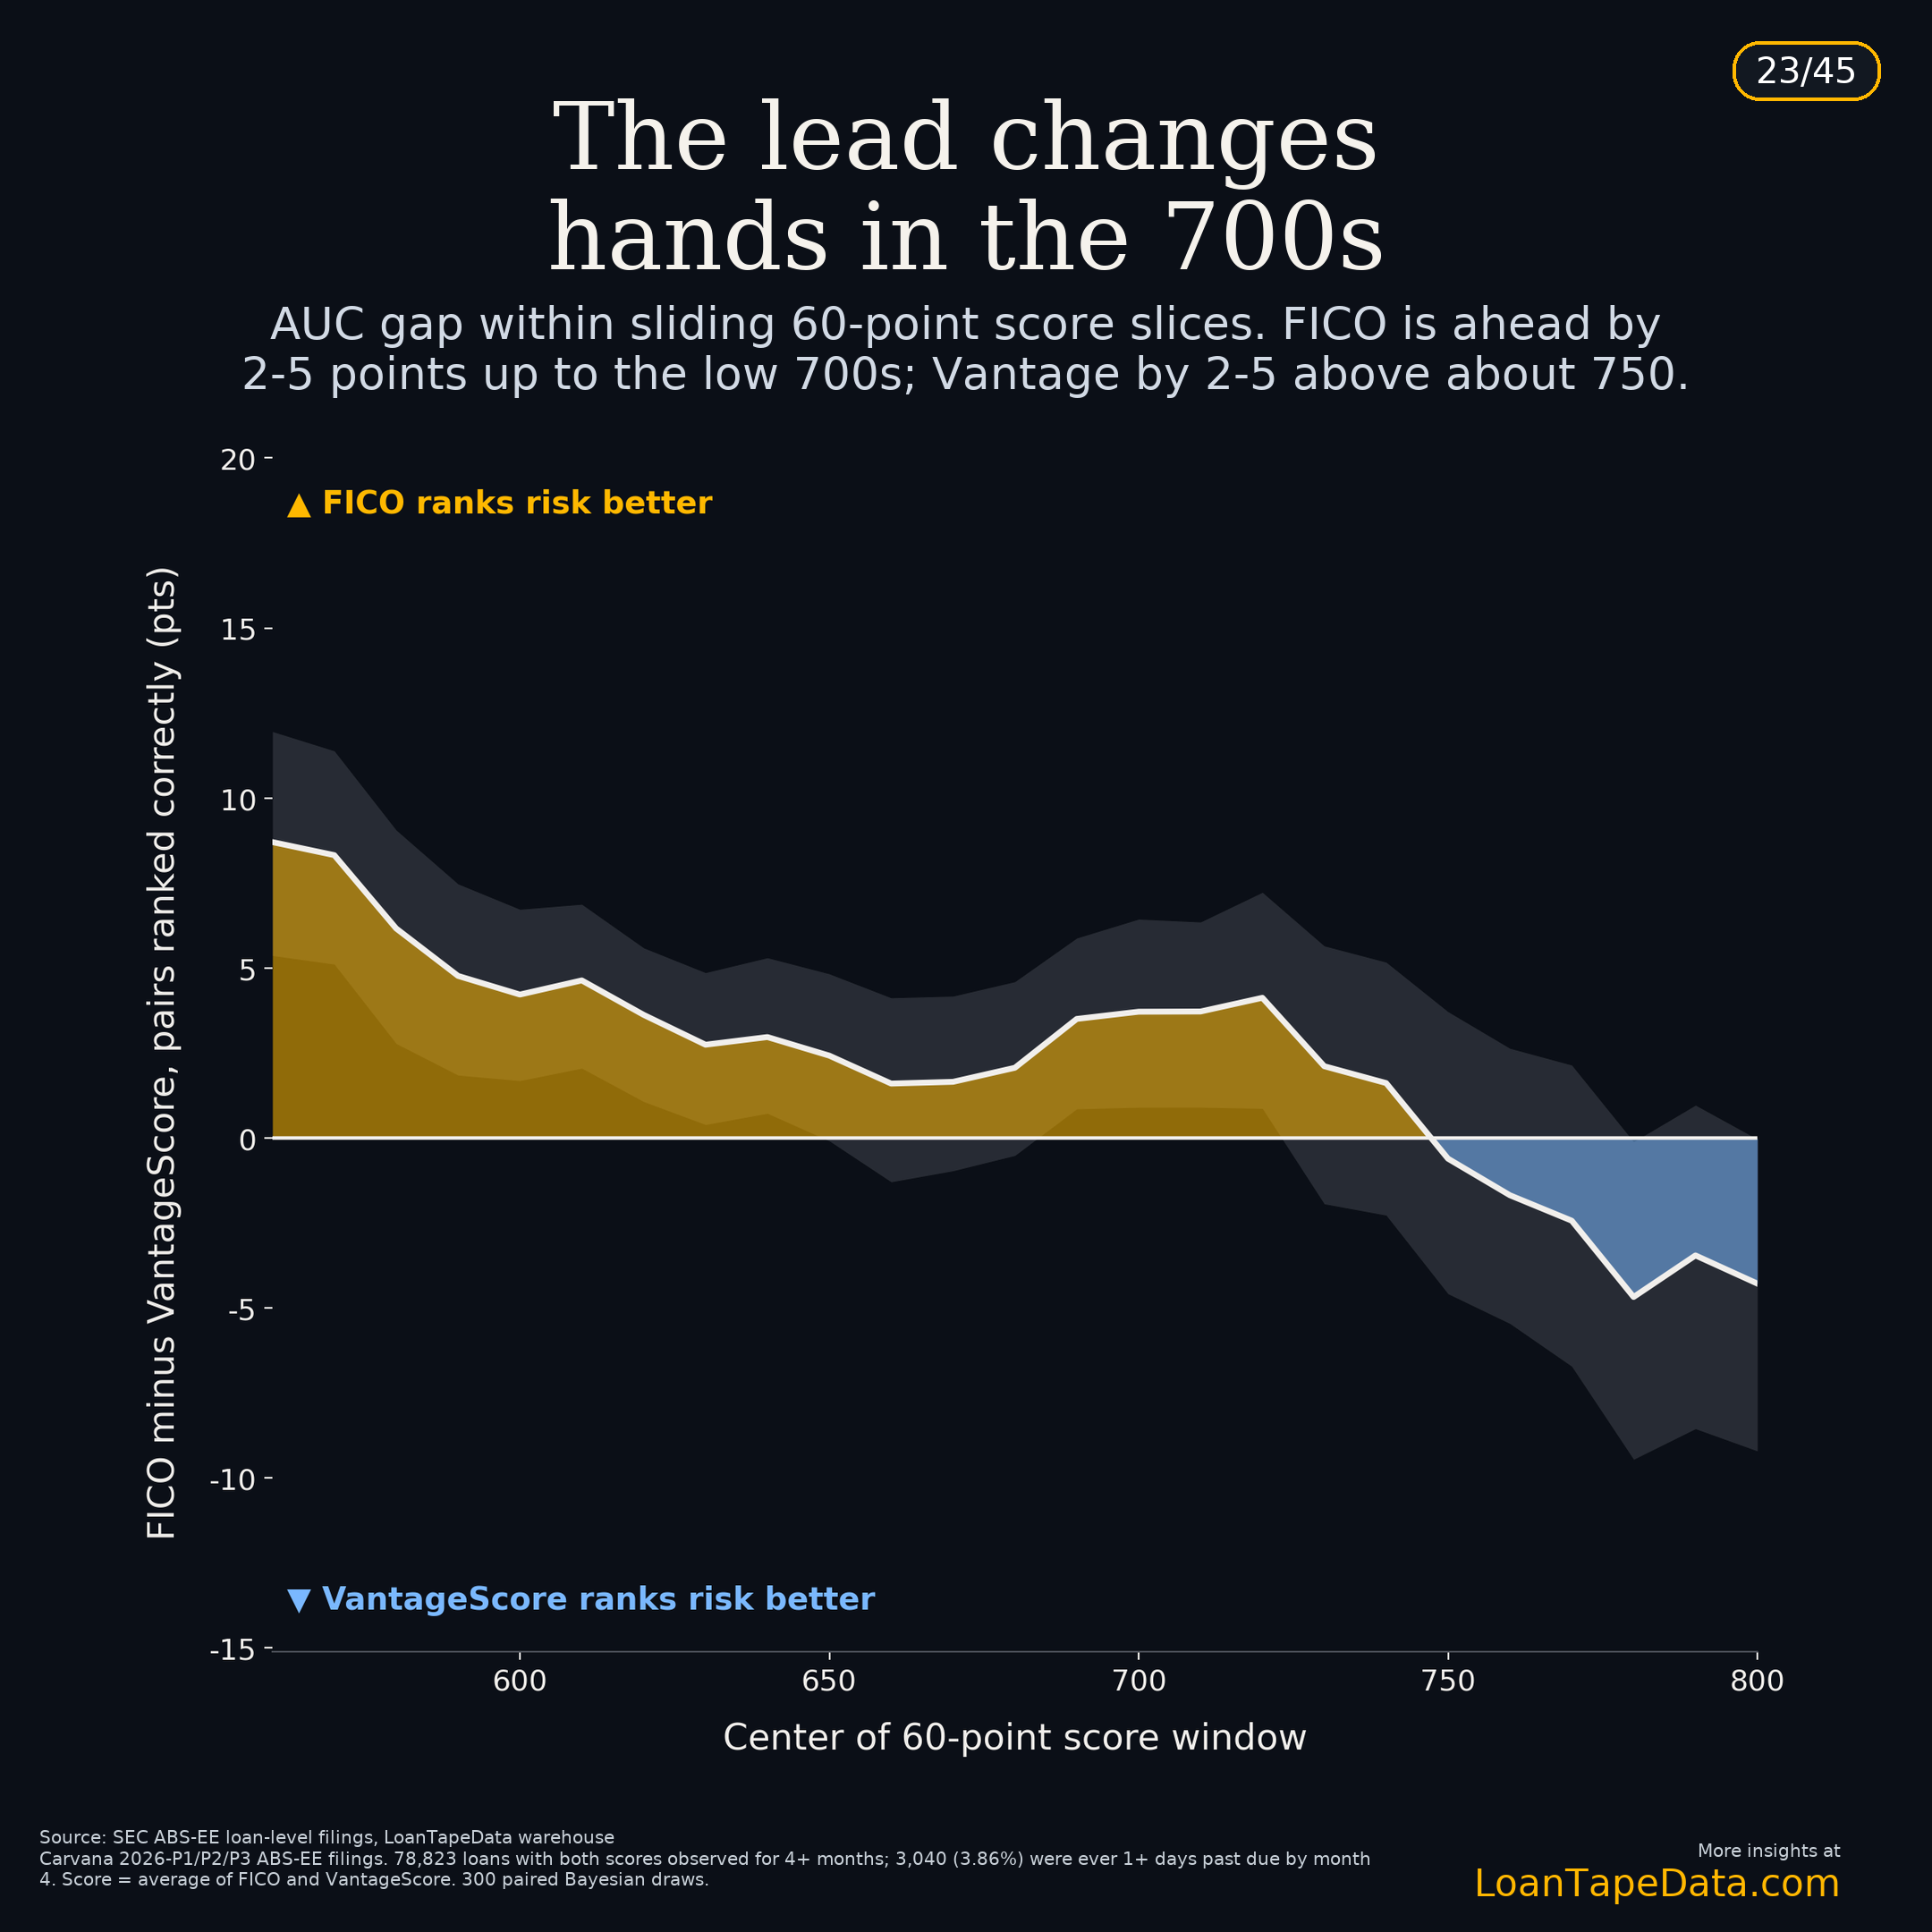
The gap crosses zero at an average score of about 747. FICO is ahead across most of the range below that, and VantageScore is ahead above it. About 71% of these borrowers sit on FICO's side of that line.
The grey band is a 90% interval, and it matters. It includes zero through part of the mid-600s and from about 730 upward. The crossing point is an estimate from this pool, and I would not treat 747 as a fixed property of either score.
The month-by-month test
Pooled results can be driven by a few filing months, so I scored each month separately. The outcome here is a loan current this month missing next month's payment. The table shows VantageScore AUC minus FICO AUC, so a negative number favors FICO.
| Filing month | Below 740 | 740+ | Misses at 740+ |
|---|---|---|---|
| Feb 2026 | +0.1 | n/a | under 30 |
| Mar 2026 | -2.6 | -5.4 | 32 |
| Apr 2026 | +0.1 | +2.6 | 52 |
| May 2026 | -1.5 | -2.3 | 100 |
| Jun 2026 | -0.6 | +3.3 | 147 |
| Jul 2026 | -1.6 | -0.8 | 106 |
| Aug 2026 | -0.4 | +1.2 | 199 |
Below 740, FICO is ahead or tied in every month, with intervals clear of zero in March, May and July. At 740+, the sign alternates and no month's interval clears zero. So the pooled VantageScore lead at the top of the range does not repeat month to month, while FICO's lead below 740 does.
What this can and cannot show
These loans are young. The oldest have about 8 months of history, which is too short to test defaults, charge-offs or losses. Rolls to 30+ DPD number only 214 to 327 across the subprime definitions I tested, too few to separate the scores. Everything here describes early payment behavior.
It is also one lender. Carvana underwrites to its own criteria, and if either score fed the approval decision, the approved pool is truncated along that score, which can tilt the comparison. The filings do not say so either way, and I cannot separate that effect from this data.
I will rerun this as the 2026 Carvana pools age. The fields behind it, including both scores and monthly delinquency status, are in our ABS-EE loan-level data. Access details are on the pricing page.
Methodology
- Universe: CRVNA 2026-P1, P2 and P3 loans filed with both a VantageScore and a FICO score, 129,768 in total. Tier and window results use the 78,823 observed for 4+ months, of which 3,040 (3.86%) were ever 1+ DPD by month 4.
- Tiers and windows: set on the average of the two scores, so neither score defines the groups.
- Tier intervals: 2,000 paired Bayesian resamples per tier, with the same weights applied to both scores.
- Window intervals: 300 paired Bayesian draws, 90% band.
- Monthly results: 200 loan-clustered Bayesian resamples per month, 90% interval, on all 129,768 loans. Months with fewer than 30 misses in a segment are dropped.