SBA Loan Chargeoff Rates: Sector Volatility Across 25 Years
Real Estate SBA borrowers who got loans in FY2007 charged off at 33.8% within five years. The FY2012 vintage for the same sector: 0.6%. That 33-point swing is what credit cycle risk actually looks like.
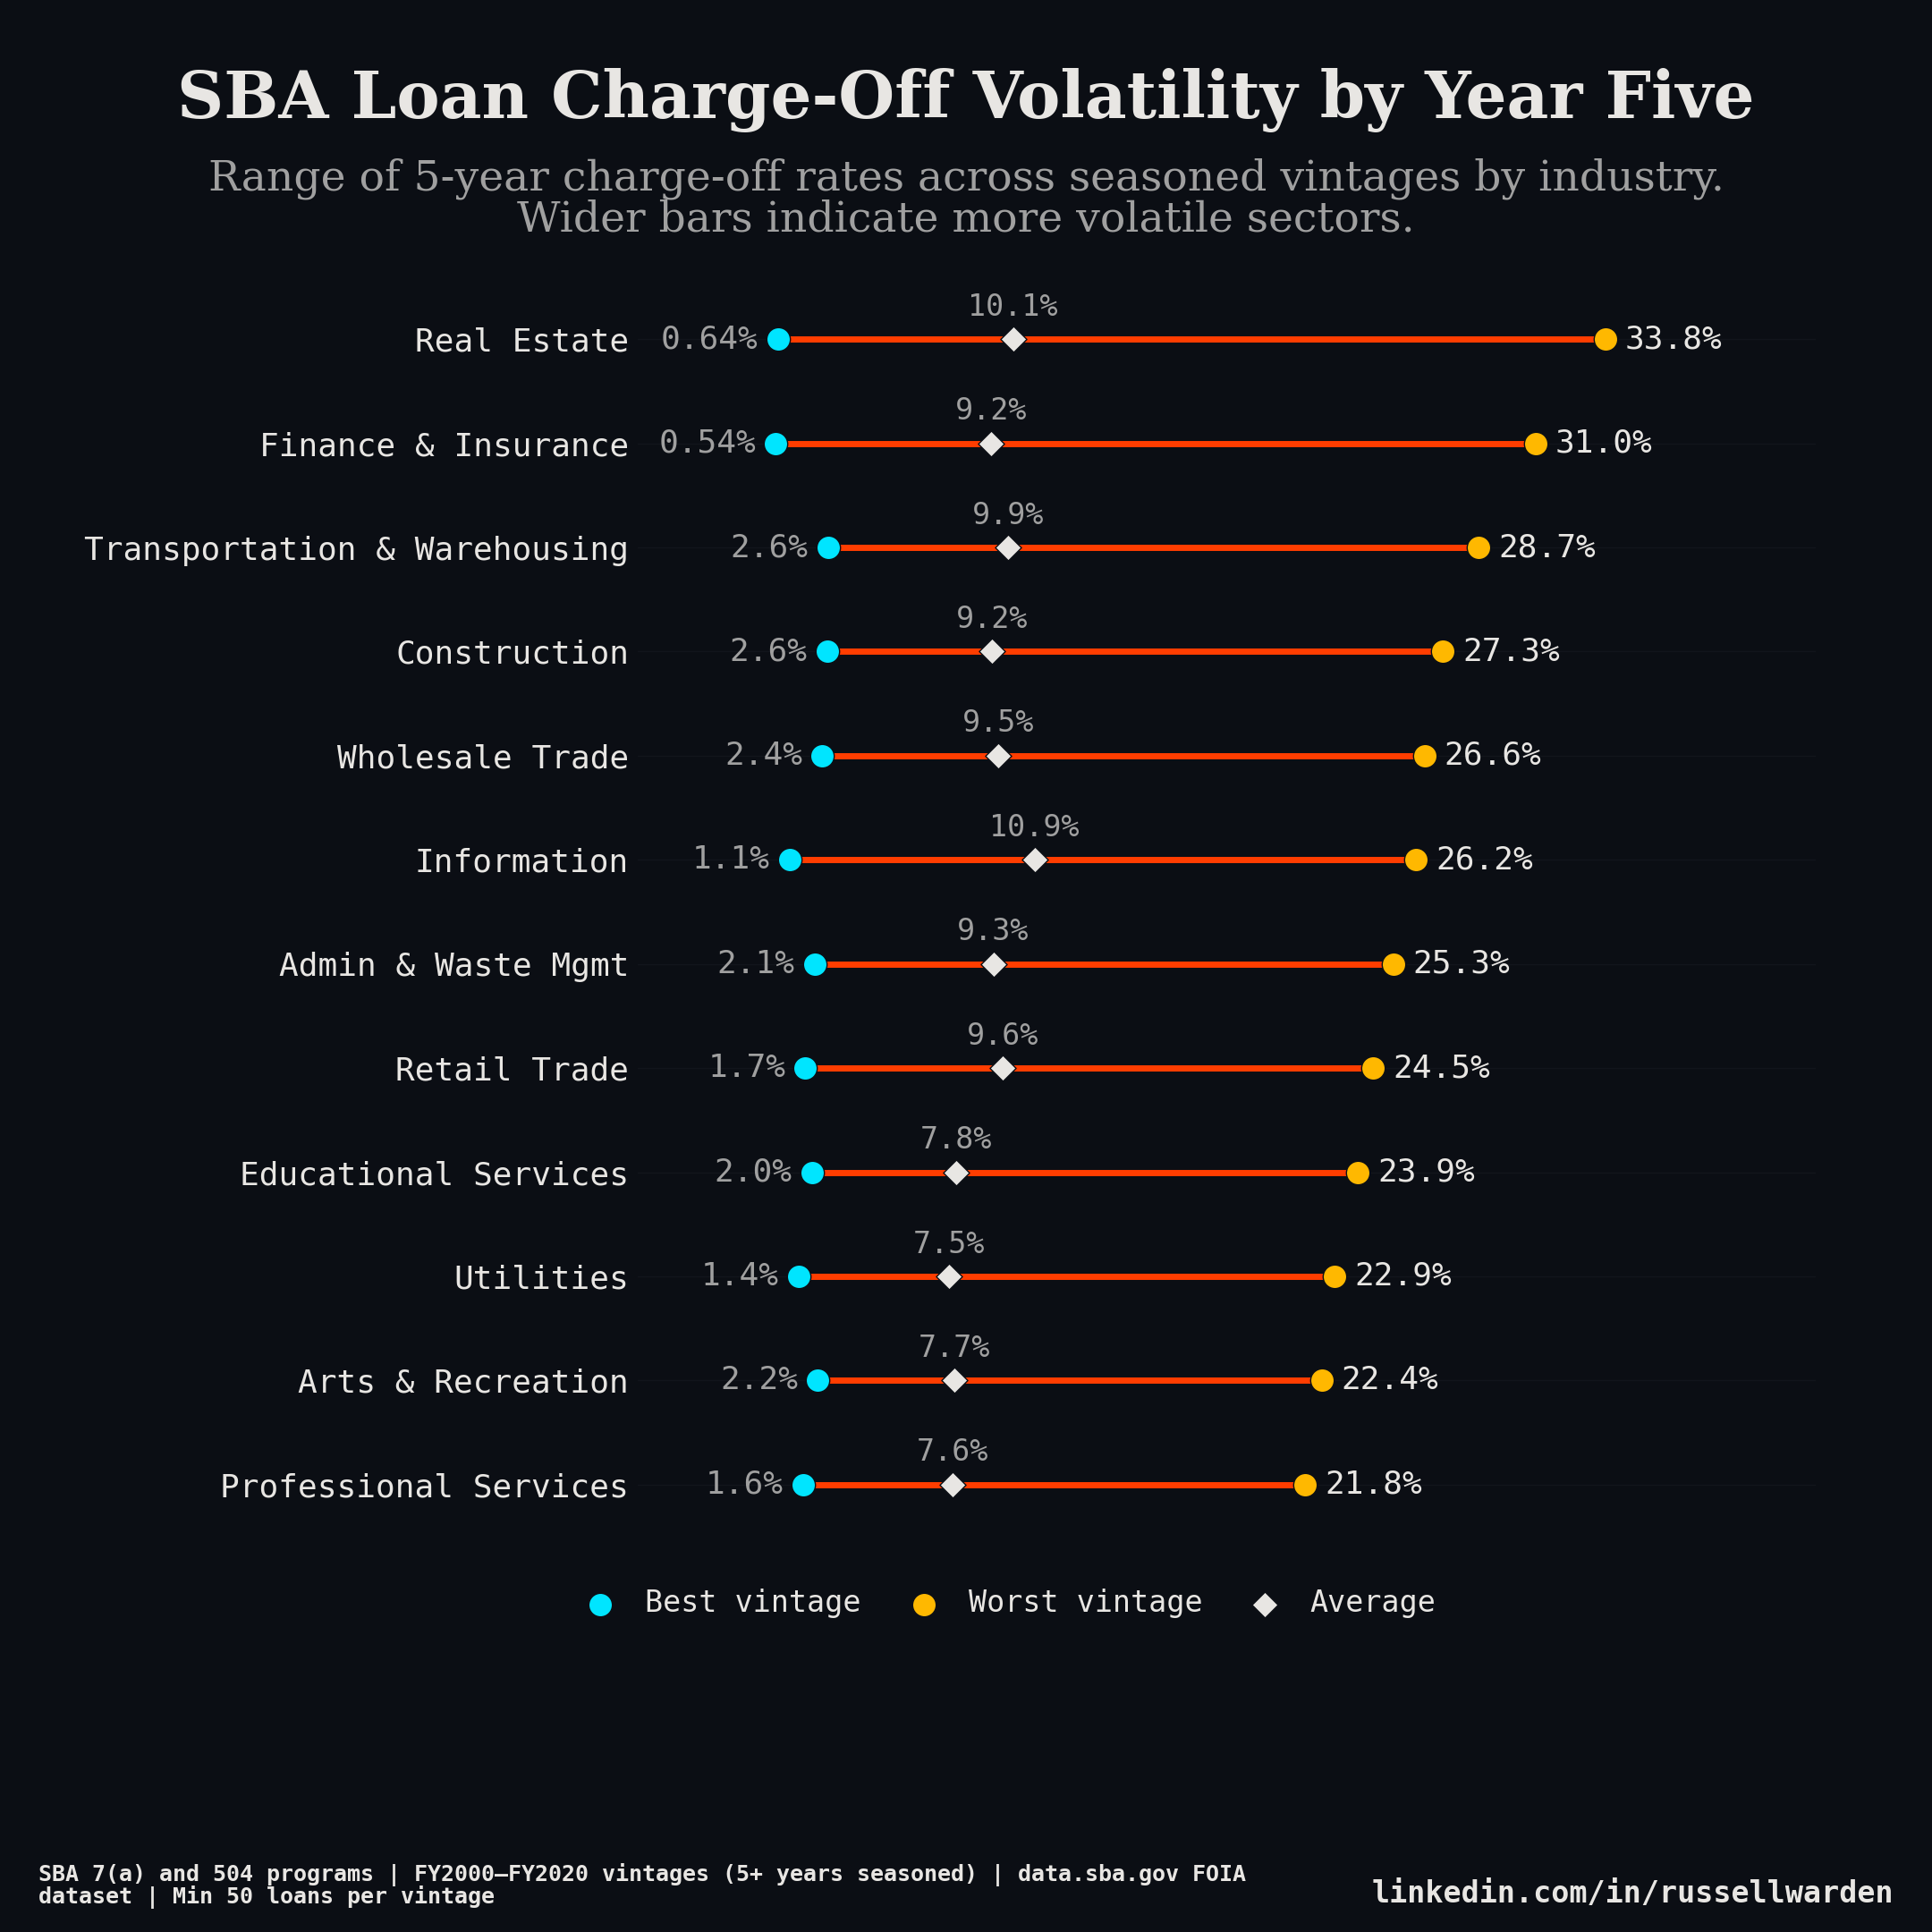
Average rates by sector are useful for benchmarking. They tell you nothing about tail risk or when to originate. I built a dumbbell chart to show the range, worst vintage to best vintage, fixed 5-year horizon, across 21 fully seasoned cohorts from FY2000 through FY2020.
How I measured this
Most SBA chargeoff analyses use cumulative lifetime rates, which mix seasoned and unseasoned loans in the same denominator. A 5-year-old loan and a 15-year-old loan both count, even though they've had very different amounts of time to fail.
I used a fixed horizon approach: for each loan, did it charge off within 5 years of the approval date? Same methodology structured finance analysts use for auto ABS vintage curves. Performance measured at a fixed point in the loan's life. Every vintage is comparable on the same basis.
For the dumbbell, I calculated the 5-year rate for every (sector, vintage) cell where at least 50 loans existed. Then I took each sector's min and max across the 21 qualifying vintages. The connector width is the spread. Wider bar, more volatile sector.
FY2020 is the last vintage. By December 2025, every FY2020 loan has had at least five years to season.
The volatile sectors
Real Estate had the widest spread: 0.6% (FY2012) to 33.8% (FY2007). Nearly one in three FY2007 real estate loans charged off within five years. The businesses may have been fine. The underlying assets weren't.
Finance and Insurance was almost as bad. 31.0% in FY2007, 0.5% in FY2012. Mortgage brokers, small insurance agencies, independent advisors. Their revenue was the financial system, and the 2007-2008 vintage was in that system when it cracked.
Transportation surprised me the most. 28.7% in FY2007, down to 2.6% by FY2012. A 26-point swing. Freight collapsed in 2008-2009 and the typical borrower here is an owner-operator with one truck, thin margins, and no cushion. I expected cyclical. Not this.
Construction: 27.3% in FY2007, 2.6% by FY2013. One step removed from housing, same dynamics.
Wholesale Trade and Information both landed around 26-27% in FY2007. Wholesale follows inventory cycles, which got liquidated hard in late 2008. Information that year was media companies and early web shops. The advertising collapse hit them before they'd built any reserves.
All six look the same on a timeline: rising steadily from FY2003, peaking at FY2006-2007, falling back to normal by FY2011-2013. The FY2006 vintage runs almost as bad as FY2007 in most sectors. Not one bad year. Two or three years of deteriorating underwriting, then a hard landing.
The stable sectors
Healthcare ranged from 1.1% (FY2020) to 11.0% (FY2007). That 11.0% crisis peak looks rough until you compare it to sectors running 25-30%. Post-2010, healthcare has settled around 1.5-2% and mostly stayed there.
Healthcare demand doesn't move with the economy. A dental practice doesn't lose patients because freight rates fall. Revenue keeps coming. These aren't recession proof businesses, but they're close enough that the credit cycle barely registers.
Agriculture: 0.4% (FY2019) to 9.5% (FY2007). Its cycle tracks commodity prices and drought more than financial markets. Some vintage years barely registered losses at all. The FY2019 vintage at 0.4% is the lowest single-sector rate in any year in this dataset.
If you're comparing Healthcare at a 2.3% average to Construction at a 4.1% average, that comparison misses what actually matters. Construction can swing 2.6% to 27.3% depending on when you originated. Healthcare stays in a band. Allocation decisions should be driven by the spread, not the mean.
What the spread means for underwriting
A lender who put 40% of their book into Construction in FY2004-2007 was not taking on a 4% loss rate. They were exposed to 27.3%. The same allocation in FY2010-2013 was a completely different bet, in the same sector.
For stress testing a 7(a) portfolio against a 2007-equivalent shock, use the sector peaks. Real Estate: 33.8%. Construction: 27.3%. Healthcare: 11.0%. The averages will have you underprovisioning by a factor of five or more in the volatile sectors.
Timing matters as much as sector selection. A 30-point spread means the difference between 0.6 cents and 33.8 cents per dollar of loss is mostly a function of vintage, not credit quality at origination. Late cycle origination in a volatile sector is a bet that the tail won't show up. It usually doesn't. When it does, you get 2007.
The program layer runs on top of all this. The previous SBA chargeoff analysis showed 504 at 0.79% vs. 7(a) at 4.24%. A 504 Construction loan and a 7(a) Construction loan are different instruments before you even get to vintage timing.
The post-crisis floor
By FY2010-2013, most sectors were back to a 2-4% steady state. Construction around 3%, Retail Trade around 3-4%, Accommodation and Food around 3-3.5%. That's where most of the risk has sat through FY2019.
FY2020 looks low across the board, but be careful reading it. COVID relief programs disrupted normal chargeoff timelines. Borrowers who would have charged off in 2020 or 2021 got EIDL capital and deferrals instead. The FY2020 vintage will look artificially clean until those deferrals resolve, and we won't have a clear picture for another year or two.
How the data is built
Six CSV files from data.sba.gov, SBA FOIA program. 7(a) and 504 combined, FY1991 through December 2025. This analysis uses FY2000-FY2020 vintages, early enough to capture the full 2007-2010 credit cycle, late enough for complete 5-year seasoning.
Minimum 50 loans per (sector, vintage) cell, minimum 8 qualifying vintage years per sector. Thin sectors are excluded. NAICS codes map to 2-digit sector per Census Bureau classification.
Full loan level data (1.5M+ loans with approval date, chargeoff date, NAICS code, business age, loan size, state, and program) is in the SBA loan performance subscription. If you're building sector stress models or want to run your own vintage analysis, pricing is here.