SBA Chargeoff Rates by Industry: Which Sectors Lose the Most?
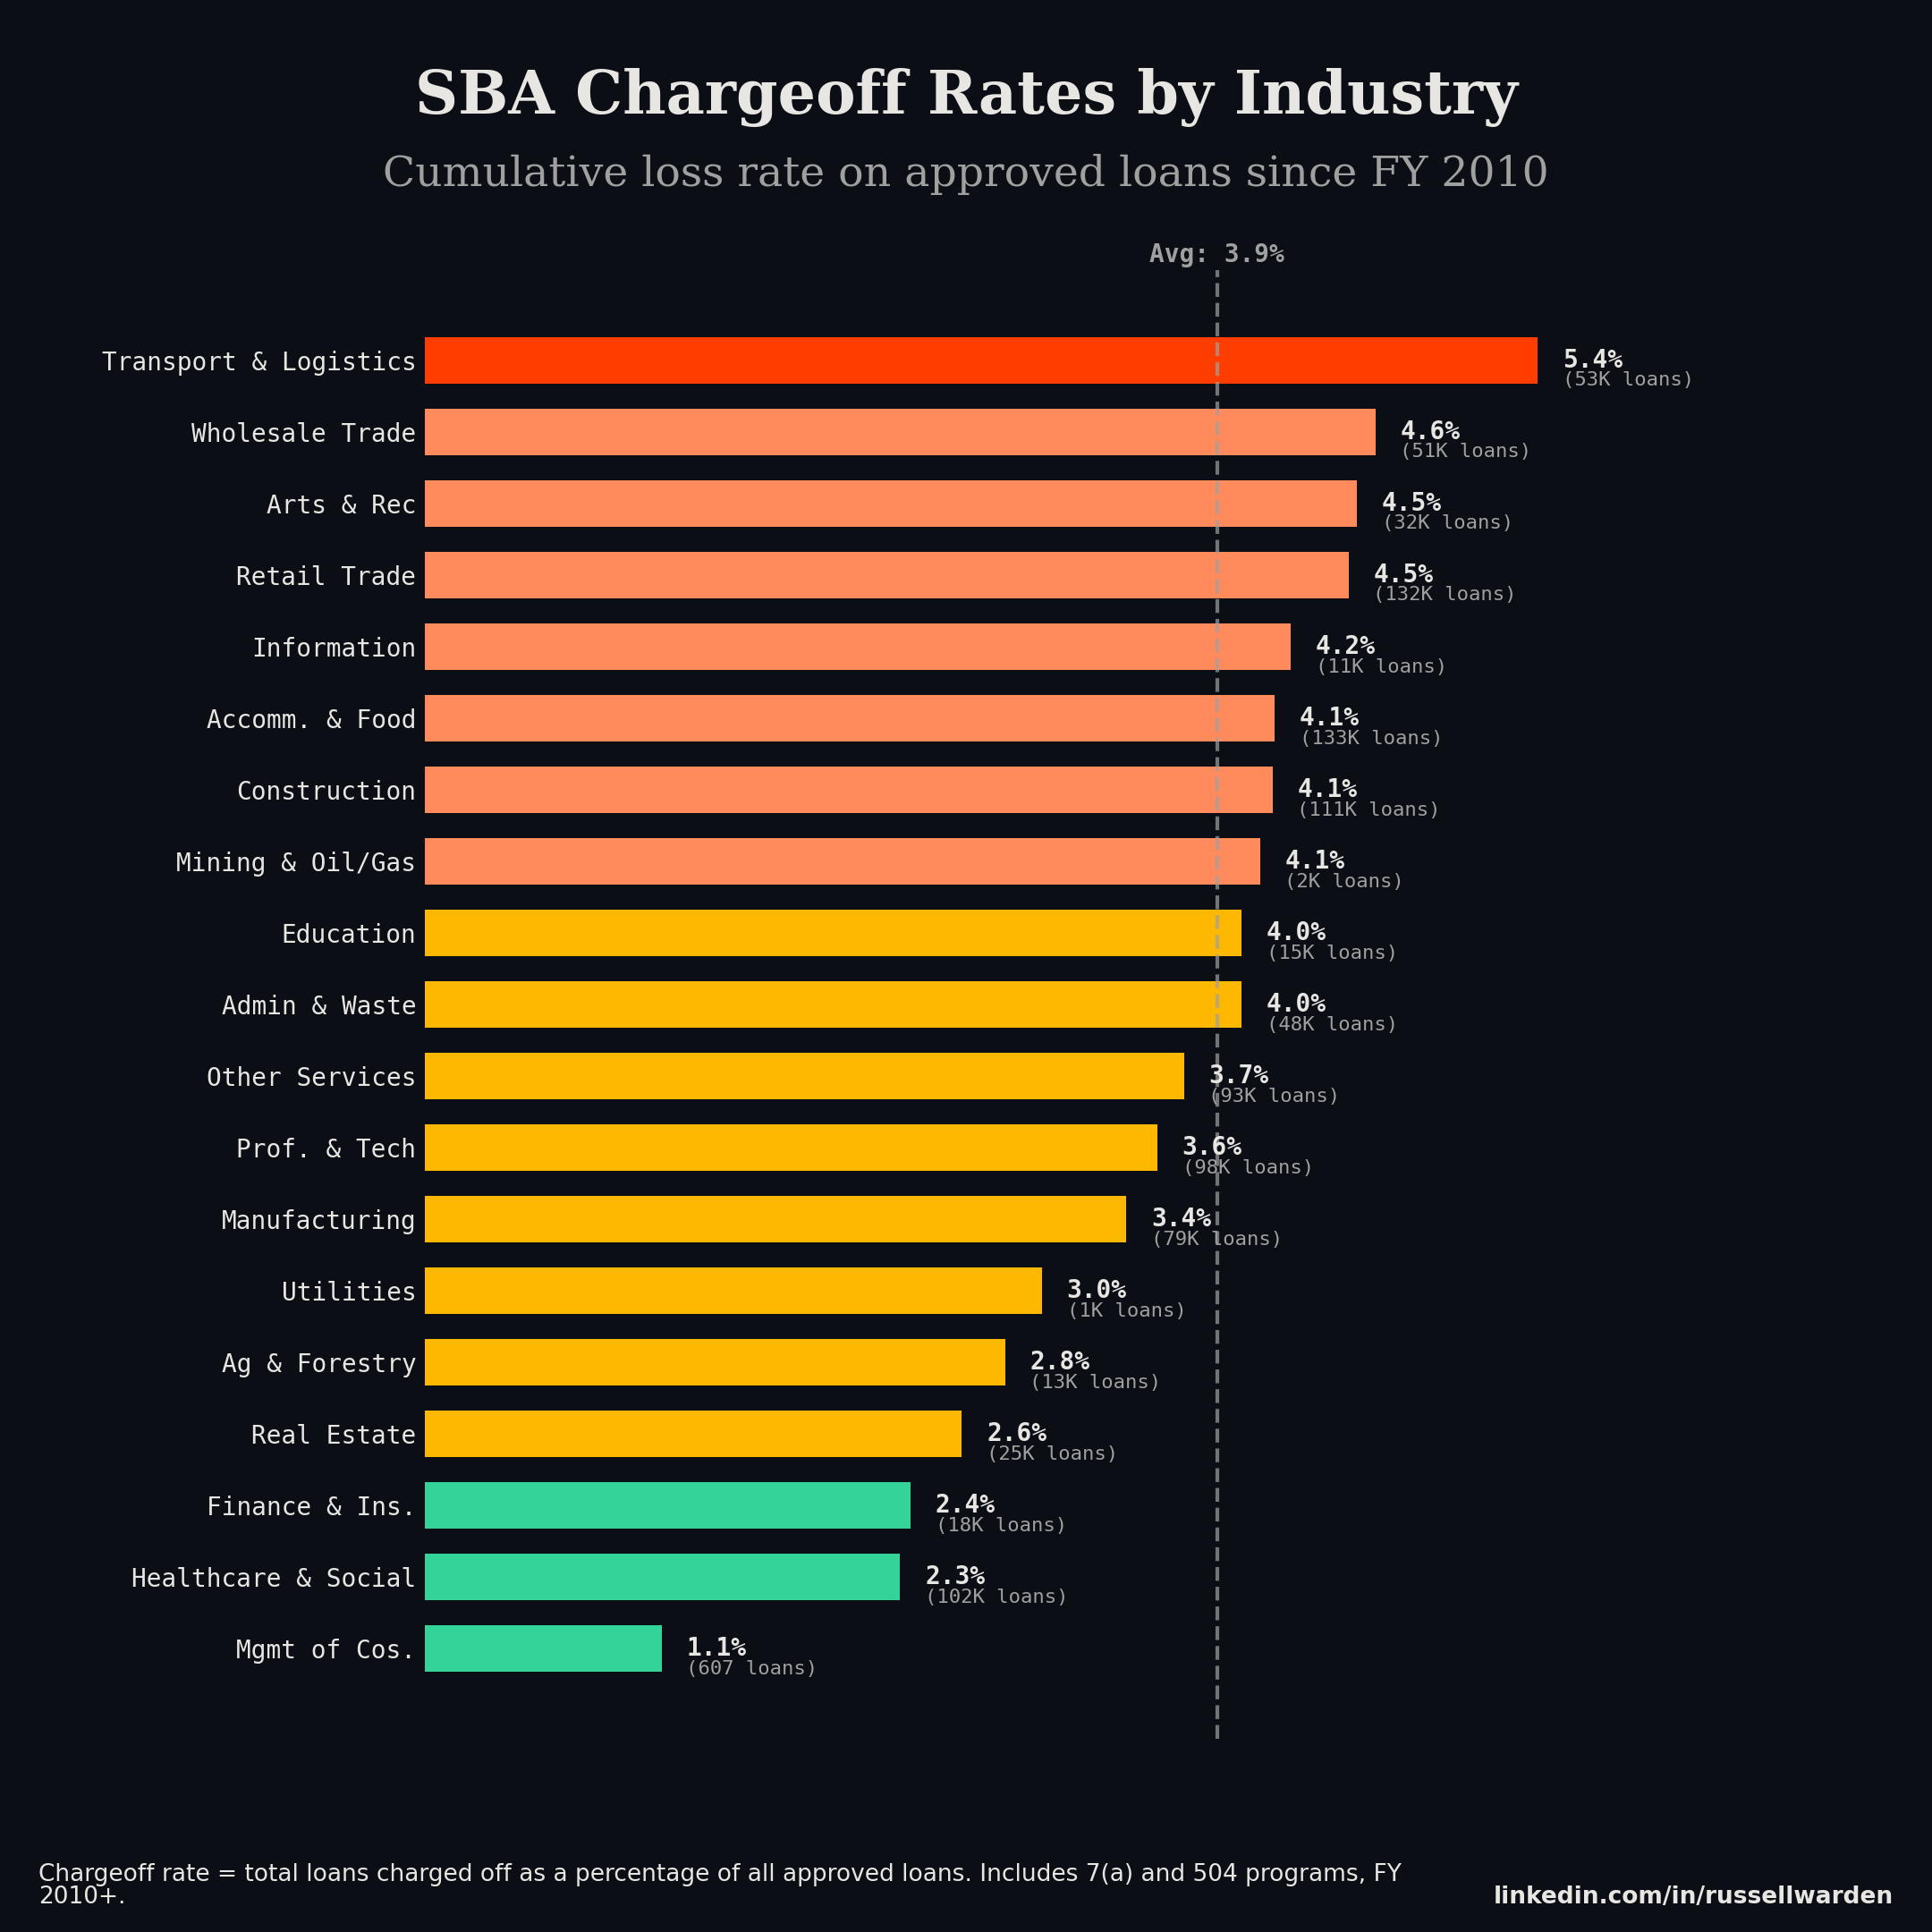
Transport and Warehousing borrowers charge off SBA loans at 5.4%. Healthcare, 2.3%. That's a 2x gap on loans backed by the same federal guarantee.
I loaded every SBA FOIA loan file, all six CSVs going back to FY 1991. Filtered to FY 2010 and later: 1,018,128 loans, $486.4 billion in approved volume across 7(a) and 504. Then grouped by NAICS sector and calculated chargeoff rates.
Every industry, ranked
| Industry | Chargeoff Rate | Loans | Approved Volume |
|---|---|---|---|
| Transportation & Warehousing | 5.41% | 52,756 | $15.4B |
| Wholesale Trade | 4.62% | 51,350 | $31.3B |
| Arts, Entertainment & Recreation | 4.53% | 31,798 | $16.4B |
| Retail Trade | 4.49% | 132,470 | $65.7B |
| Information | 4.21% | 10,700 | $4.4B |
| Accommodation & Food Services | 4.13% | 132,730 | $87.8B |
| Construction | 4.12% | 111,366 | $34.1B |
| Admin & Waste Management | 3.97% | 48,252 | $14.5B |
| Educational Services | 3.97% | 14,718 | $6.2B |
| Other Services | 3.69% | 93,446 | $37.9B |
| Professional & Technical Services | 3.56% | 97,849 | $35.5B |
| Manufacturing | 3.41% | 78,721 | $49.4B |
| Agriculture & Forestry | 2.82% | 13,060 | $8.1B |
| Real Estate & Leasing | 2.61% | 24,585 | $14.7B |
| Finance & Insurance | 2.36% | 17,722 | $7.6B |
| Health Care & Social Assistance | 2.31% | 101,969 | $54.5B |
| Management of Companies | 1.15% | 607 | $0.5B |
Overall rate across the program: 3.85%.
Where the losses concentrate
Transportation leads for reasons you'd expect. Owner-operator trucking, small freight outfits. Average loan is $292,000 on a 107 month term, the shortest of any major sector. Fuel costs move fast, freight rates move faster, and a one-truck operation doesn't have much cushion. The 50% paid in full rate tells you the other half of the story.
The two sectors worth watching are Retail Trade and Accommodation & Food, because of sheer size. They each have 132,000+ loans. Accommodation & Food alone is $87.8 billion in approved volume. Its chargeoff rate of 4.13% is only slightly above average, but 4.13% of $87.8 billion is the largest absolute loss pool in the program. 5,481 loans charged off.
Healthcare is interesting because it's big (102,000 loans, $54.5B) and safe (2.31%). Average term is 168 months with a $534,000 average loan. These are mostly medical practices buying real estate. I suspect the collateral and the recession-resistant revenue are both doing work here, though the FOIA data doesn't let me prove that directly.
Real Estate is 2.61% on a 177 month average term. Collateral is the loan.
I honestly don't have a great explanation for why Manufacturing (3.41%) outperforms Construction (4.12%) by as much as it does. Both are capital intensive. Both have cyclical revenue. The average Manufacturing loan is twice the size ($627K vs $307K), which might mean the underwriting is tighter on bigger asks, but that's speculation.
The 7(a) vs 504 gap is bigger than any industry gap
This was the most interesting thing in the data. 7(a) charges off at 4.24%. 504 charges off at 0.79%.
That's 5x. The spread between the best and worst industries is 2.66 percentage points. The spread between programs is 3.45 points.
504 requires 10-20% borrower equity, is limited to real estate and major equipment, and goes through a CDC. So the program's structure filters out a lot of risk before the loan ever gets booked. When you look at Accommodation & Food's 4.13% blended rate, that's almost entirely the 7(a) book. The 504 restaurants are doing fine.
For anyone building an SBA portfolio, program mix probably matters more than industry mix.
Don't trust the recent vintages
| Vintage | Chargeoff Rate | Loans |
|---|---|---|
| FY2010 | 7.10% | 54,833 |
| FY2014 | 5.18% | 57,929 |
| FY2017 | 6.21% | 68,648 |
| FY2019 | 4.78% | 58,006 |
| FY2022 | 2.21% | 56,932 |
| FY2024 | 0.38% | 76,235 |
FY2024 at 0.38% doesn't mean those loans are good. It means they're 18 months old. FY2010 at 7.10% has had 15 years to season. The lifetime rate for FY2022-2024 won't be clear for another five to seven years, and the industry rates I showed above blend everything together. The real seasoned rate for Transport is probably north of 5.4%.
$6.3 billion
39,187 loans have charged off since FY 2010. $6.29 billion in gross losses. $160,489 average per loan.
The SBA guarantee covers 50-85% of each loan. The lender eats the rest. If your book is heavy in Transportation and 7(a), your retained losses look different than if you're in Healthcare and 504.
How I built this
Six CSV files from SBA FOIA. 7(a) and 504 programs, FY 1991 through December 2025. Filtered to FY 2010+ approvals (1,018,128 loans). Mapped NAICS codes to 2-digit sectors per Census Bureau classification. Chargeoff rate = loans with CHGOFF status divided by total loans per sector.
The FOIA data has no delinquency fields. No 30/60/90 buckets, no current vs past due. Terminal status only: charged off, paid in full, or active. Good for lifetime loss rates, useless for early warning. For loan level delinquency data on auto ABS, we have that in the ABS-EE dataset.
Full SBA loan-level data updated quarterly. Pricing here.