The 25% SBA Drop That Wasn't
When we first pulled the FY26 first-half SBA data, our initial conclusion was simple. 7(a) and 504 approvals came in at $17.6 billion for October 2025 through March 2026, down from $22.7 billion in the same calendar window a year earlier. That's a 22.5% drop in dollars and a 36.6% drop in loan count. Our read at that point was that small business lending was cooling fast.
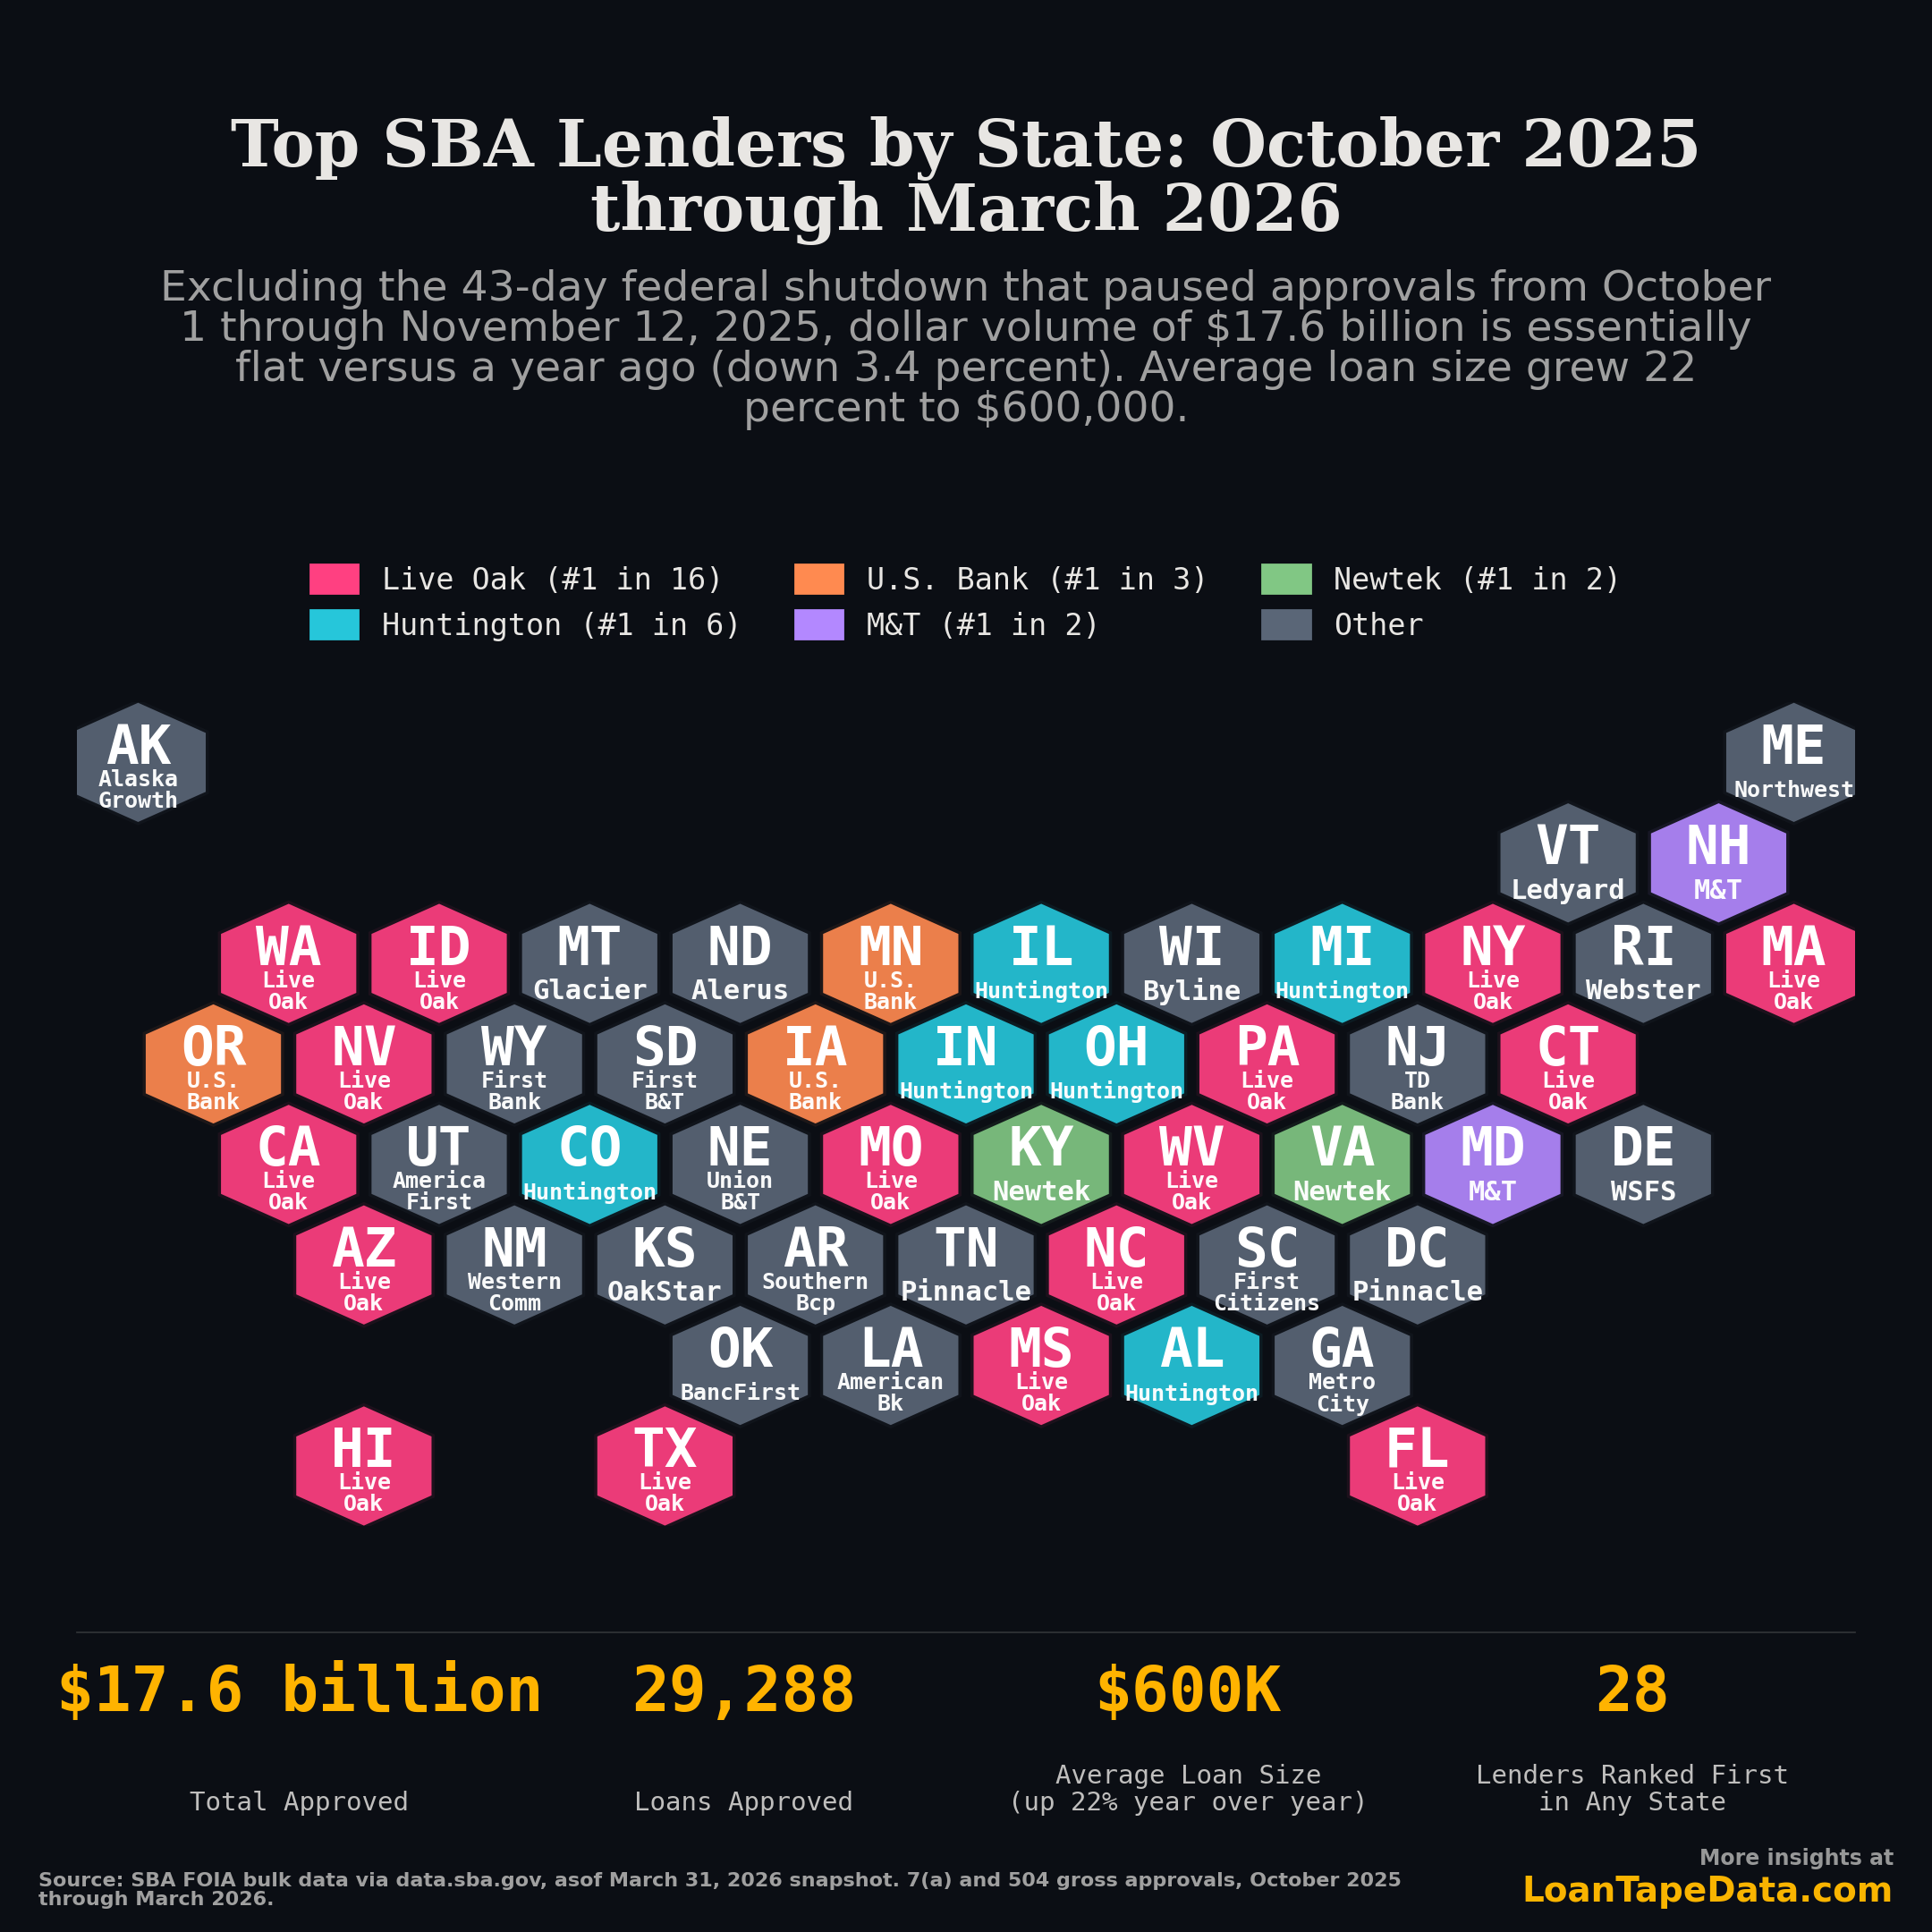
Then we dug in to find out why. Back out the 43-day federal shutdown that closed SBA approvals from October 1 to November 12, 2025, and dollar volume is down about 3.4% year over year. Loan count fell almost a fifth. Ticket size ran the other way, up 22% to roughly $600,000.
What the shutdown actually did to the data
The FY2026 federal shutdown ran from October 1 through November 12, 2025. That's 43 consecutive days, the longest in U.S. history. SBA approved zero new 7(a) or 504 loans during that window. Approvals resumed November 13 with a backlog burst as lenders pushed through pre-shutdown applications.
At first, we thought our data pipelines were broken when there was no data for October 2025.
Anyone pulling "the last two quarters" off data.sba.gov is comparing 182 calendar days of approvals against 139. Of course the totals look down. The day count is down by a quarter.
The fall caught us off guard. Once we caught it, the fix was obvious: compare matching windows on both sides.
| Metric | Nov 13, 2025 - Mar 31, 2026 | Same window prior year | YoY change |
|---|---|---|---|
| Loans approved | 29,288 | 36,371 | -19.5% |
| Gross approvals | $17.57 billion | $18.19 billion | -3.4% |
| Average loan size | $600,000 | $500,000 | +20.0% |
Where the volume actually went
Across 50 states, DC, and 4 territories, 28 different lenders were the largest SBA 7(a) approver in at least one place for October 2025 through March 2026. The leaderboard is concentrated enough that one lender's risk appetite is the program's risk appetite, more or less.
| Lender | States ranked first | 7(a) approvals in those states |
|---|---|---|
| Live Oak Banking Company | 16 | $753M |
| The Huntington National Bank | 6 | $286M |
| U.S. Bank | 3 | $48M |
| Metro City Bank | 2 | $44M |
| M&T (Manufacturers and Traders) | 2 | $38M |
| Pinnacle Bank | 2 | $31M |
| Newtek Bank | 2 | $28M |
Live Oak alone was the largest 7(a) lender in nearly a third of the country. The geographic pattern is unsurprising once you overlay each bank's operating footprint. Live Oak's strength runs along the coastal South and West (Florida, North Carolina, Massachusetts, Texas, California, Nevada), which is roughly where their commercial book is. Huntington wins its Midwest banking region cleanly: Ohio, Michigan, Illinois, Indiana, Kentucky, Alabama. U.S. Bank picks up the upper Plains and Pacific Northwest.
That concentration matters for credit modeling. When one lender originates 20% or more of national volume, its underwriting decisions correlate across that share. If Live Oak tightens credit on a specific NAICS code, you see it in 16 states at once. If their risk team gets squeezed by a couple of bad vintages, the program's overall composition shifts in a way that smaller lender turnover wouldn't produce.
If you're holding SBA 7(a) paper, "is the program healthy" is almost the wrong question. The one to ask is whether the handful of lenders driving most of the program are healthy. Loan-level FY26 vintage performance data is where to look.
A second pattern in the leaderboard is worth noting. A long tail of very small lenders win exactly one state apiece. Twenty of the 28 top-state lenders are #1 in only one state, and most of those one-state lenders are state or regional banks (BancFirst in Oklahoma, Glacier Bank in Montana, Ledyard National Bank in Vermont, Banco Popular in Puerto Rico). The map looks geographically distributed, but most of the dollar volume runs through the top three names. The other 25 lenders in the leaderboard control about 7% of the volume associated with #1-state slots combined.
That's a fragile structure. If any of Live Oak, Huntington, or U.S. Bank pulls back materially, no single regional lender has the capacity to fill that gap at the same speed. The state-level leadership pattern is real, but it doesn't change the fact that SBA 7(a) is a three-lender market with a long tail of brand presence.
The composition shift nobody's talking about
Bigger average loans. From $500K to $600K in twelve months. That's the actual post-shutdown story.
A 20% jump in average ticket size doesn't happen because demand changed. It happens because the borrower mix shifted. We have a few competing explanations, all partly supported by the data.
Backlog clearing probably favored larger applications. When SBA reopened on November 13, lenders had over six weeks of in-process work to push through. The applications that get processed first tend to be the more complete, more sophisticated packages. Small first-time borrowers with thinner files probably ended up at the back of the line.
Smaller loans may also have routed elsewhere. A 7(a) approval below $200,000 isn't dramatically more attractive to lenders than a non-SBA small business term loan or a fintech product. When SBA's queue was uncertain during October, some lenders likely sent small-ticket originations to other channels and never brought them back.
And the 504 program is up around 15% over the same window. Real estate-backed SBA debt held up while general working capital 7(a) softened. That's a different borrower: typically more established, with larger commercial real estate transactions. If you're modeling SBA performance against the 504 program separately, you're seeing a different pattern than the 7(a) decline alone suggests.
A book where the average loan is $600K instead of $500K has different default characteristics. Larger borrowers are usually more established and bring more collateral to the table. They also concentrate exposure: a $600K default is a $100K bigger hit than a $500K default. The expected value math probably nets out close to neutral, but the loss distribution gets fatter-tailed.
What to watch in the June 2026 snapshot
The next SBA FOIA release comes out at the end of June. Q1 2026 alone is the cleanest read on what's coming next, since January through March has no shutdown overlap with prior years. That period is down 8.7% in dollars and 27% in loan count, which is softer than the half-year view. So there is some real cooling at the small-ticket end. Just not the catastrophic kind the raw calendar comparison implied.
The thing I'll personally be watching is whether Live Oak picks up a 17th or 18th state. If they do, the program's underwriting standards get even more correlated with one bank's risk team. Worth modeling.
There's also a reporting-lag wrinkle. Late-March 2026 approvals may still be entering as lenders submit, so some Q1 2026 numbers will probably revise up a few percent in the June snapshot. The raw -25% number has some chance of softening from data completion alone.
Methodology
Numbers are pulled from SBA FOIA bulk data via data.sba.gov, as-of March 31, 2026 snapshot. 7(a) and 504 program approvals where gross_approval > 0. Year-over-year comparison uses the matching November 13 through March 31 window in both years to remove the shutdown gap.
State-level lender ranking uses 7(a) approvals only. The 504 program is intermediated through Certified Development Companies and operates differently enough that mixing the two would muddle the lender picture. Live Oak's $753M figure is its 7(a) volume in the 16 states where it was the largest 7(a) lender, not its national 7(a) total.
There are two ways to count SBA dollar volume: gross approval (what we use here) and "funded only" (which excludes canceled and not-funded approvals). The two can differ by close to 10% in any given period, so any comparison between sources needs to specify which filter is in use. We use gross approval throughout.
If you want to reproduce or extend the analysis, the snapshot data is in our SBA 7(a) dataset and SBA 504 dataset. Both are loan-level, with 7(a) coverage back to FY2020 and 504 back to FY2010. Pricing here.