SBA Loan-Level Delinquency Is Public for the First Time
The SBA's published 7(a) and 504 data dictionary still tells you that loans in the EXEMPT status are protected under FOIA Exemption 4. The April 2026 quarterly data release exposed them anyway. For the first time, you can see at the loan level which SBA borrowers are currently delinquent, which are in liquidation, and which are just performing.
In the same release, the LoanStatus field went from 5 codes to 13. The eight new codes broke open two old catch-all buckets. Seven came out of EXEMPT: CURR, DELINQ, PSTDUE, DEFERD, LIQUID, PURCH(NOT C/O), and SOLDNC. All seven describe loans that were active or in workout but not formally charged off. Two came out of CHGOFF: CLSLN (closed after charge-off) and SOLDCO (sold charge-off).
We pulled the file. Here is the first lender-level look.
What the chart shows
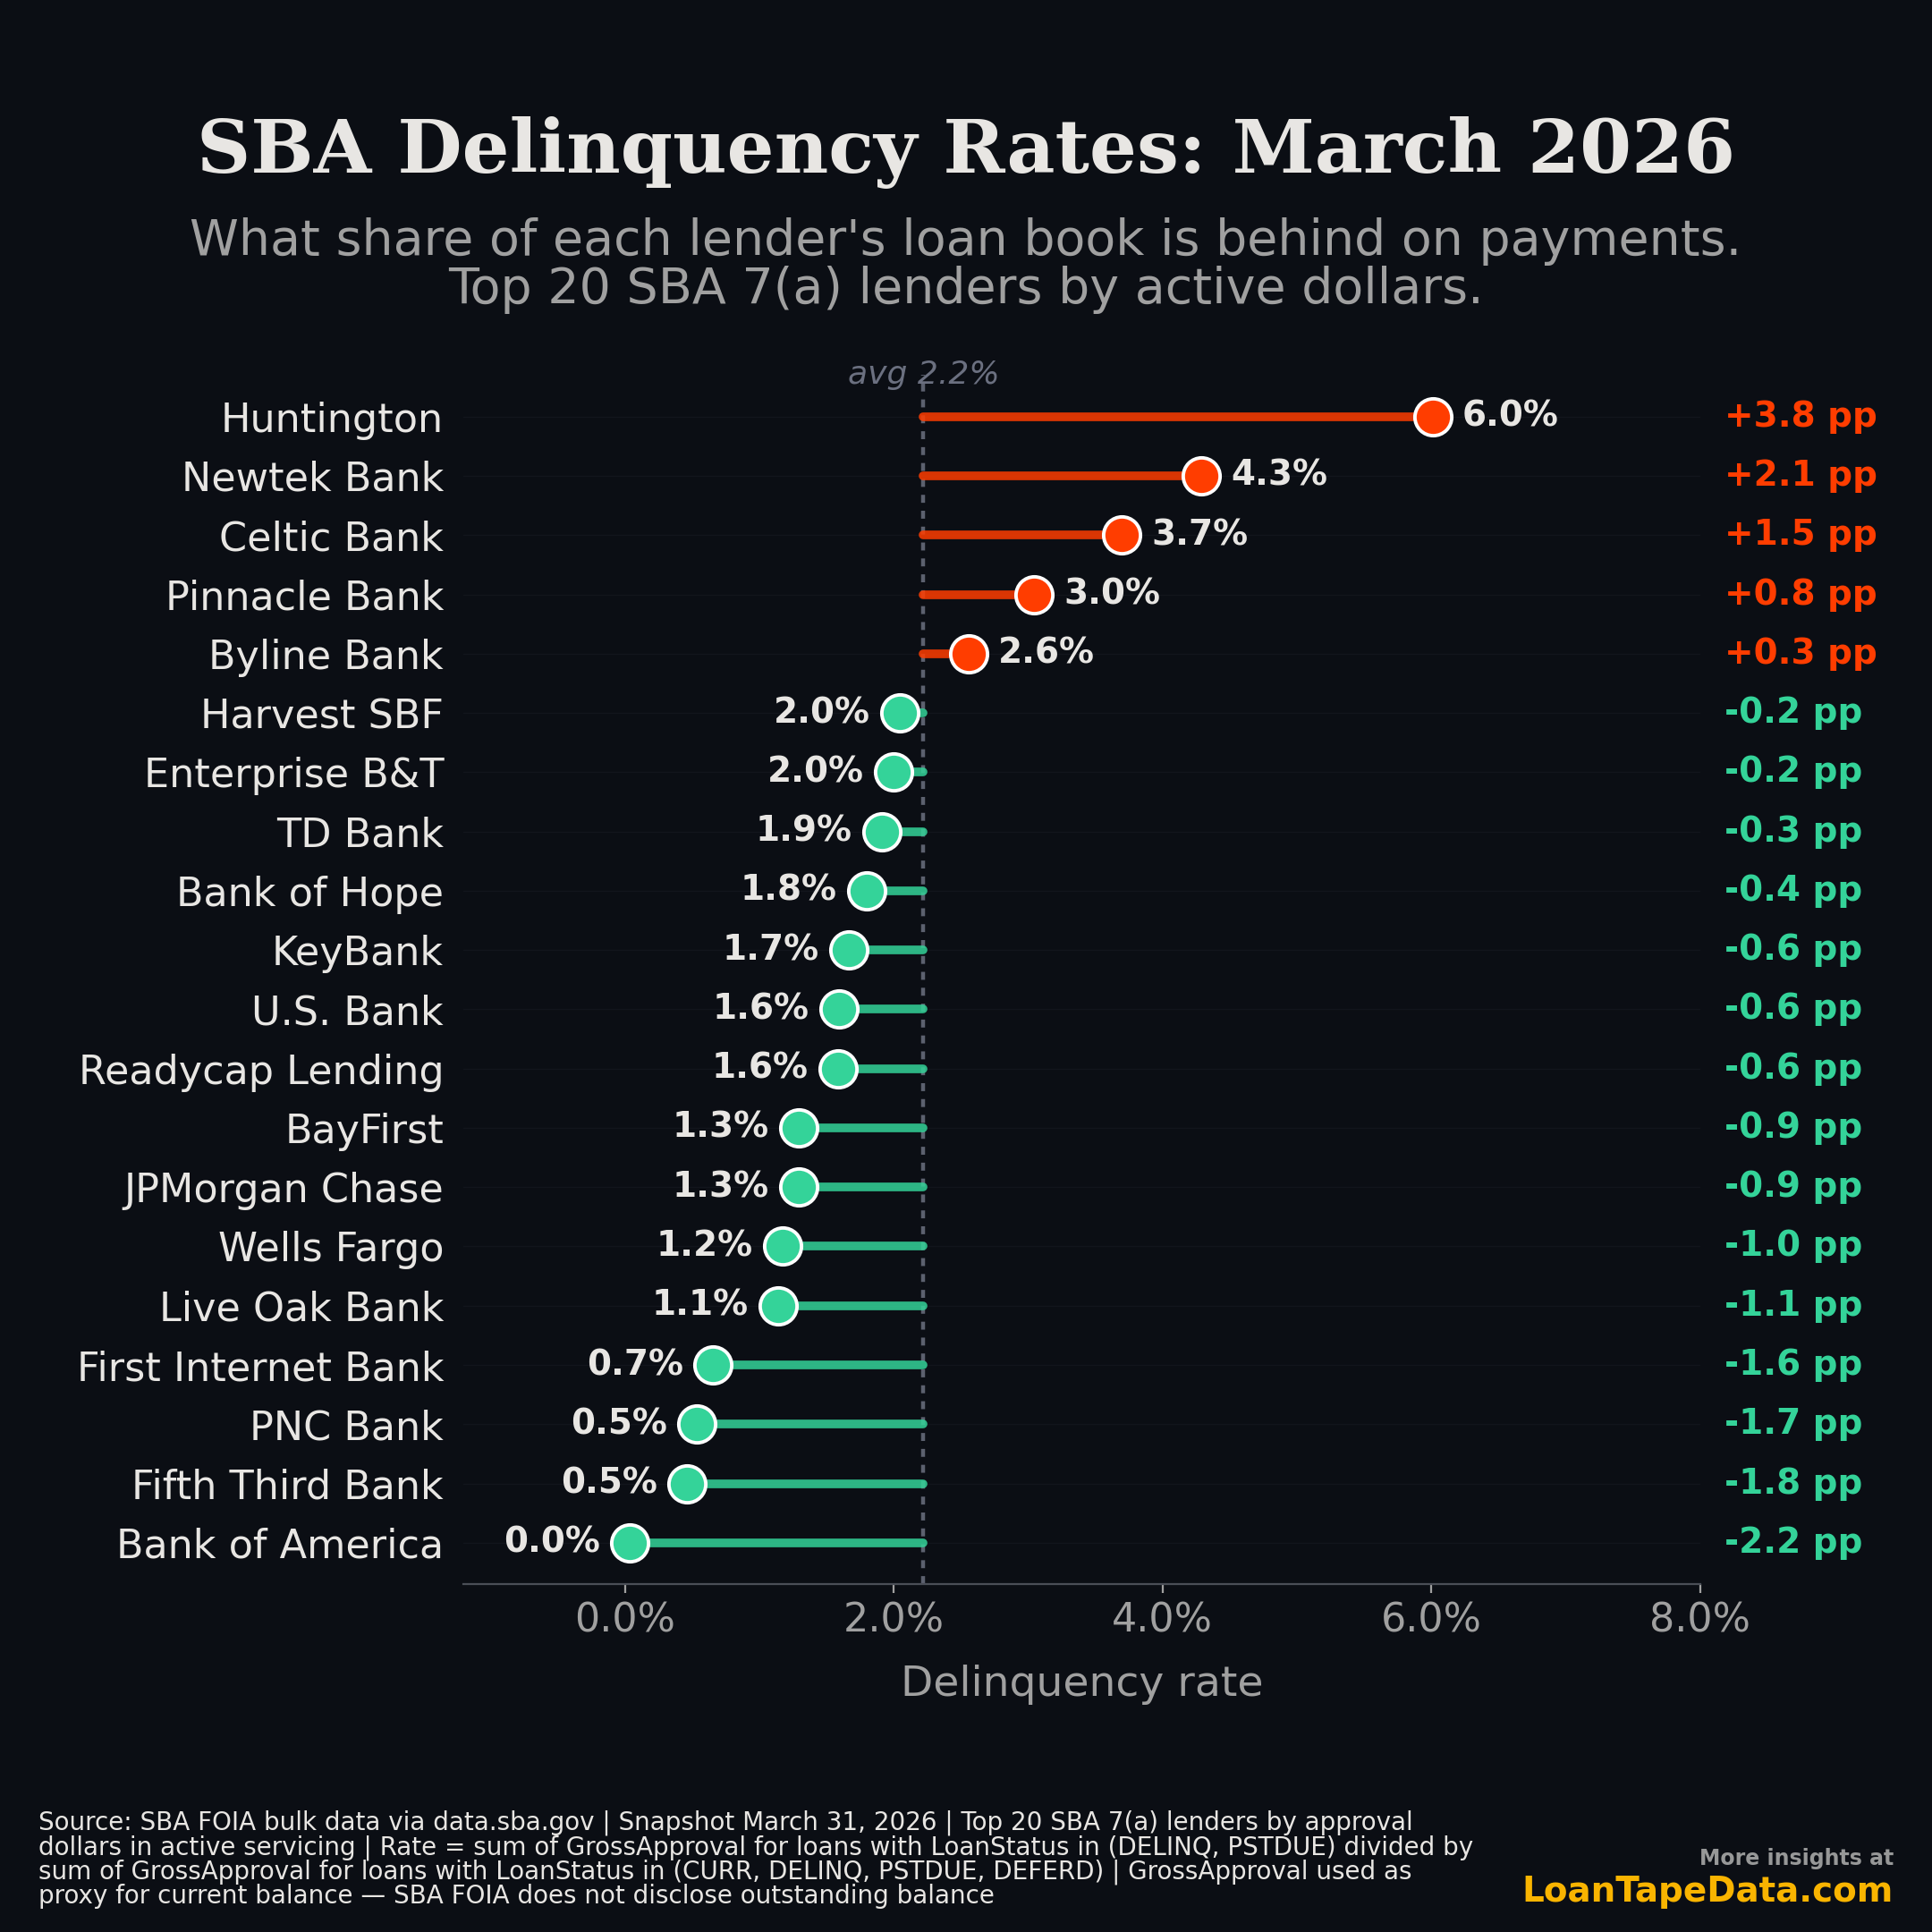
Across the 20 largest SBA 7(a) lenders by active book, the dollar-weighted delinquency rate is 2.2%. The spread is wide.
| Rank | Lender | Delinquency rate | vs avg |
|---|---|---|---|
| 1 | Huntington | 6.0% |
+3.8 pp |
| 2 | Newtek Bank | 4.3% |
+2.1 pp |
| 3 | Celtic Bank | 3.7% |
+1.5 pp |
| 4 | Pinnacle Bank | 3.0% |
+0.8 pp |
| 5 | Byline Bank | 2.6% |
+0.3 pp |
| ... | ... | ... | ... |
| 18 | PNC Bank | 0.5% |
-1.7 pp |
| 19 | Fifth Third Bank | 0.5% |
-1.8 pp |
| 20 | Bank of America | 0.0% |
-2.2 pp |
Huntington's 6.0% rate is almost three times the top-20 average. They also run the largest active 7(a) book in the country, with $8.1B of approved volume currently in servicing. Bank of America's number, $0.7M of $1.85B, rounds to 0.0%.
How that 2.2% average is calculated matters before you read into any single bar.
The numerator is the sum of GrossApproval for loans currently in DELINQ or PSTDUE. The denominator is the sum of GrossApproval for loans in CURR, DELINQ, PSTDUE, or DEFERD. Those four codes are the ones the SBA uses for loans in active servicing. Charged-off, paid-in-full, and cancelled loans are not in either.
GrossApproval is the original approved loan amount. SBA does not disclose outstanding balance in the FOIA file. So this is a dollar-weighted view, not a current-exposure view. Old loans are weighted at their original size even if most of the principal has paid down.
What was hidden inside EXEMPT
Before this release, the LoanStatus field had 5 values for 7(a) loans:
| Code | Count (Dec 2025) | Meaning |
|---|---|---|
PIF |
1,147,588 |
Paid in full |
EXEMPT |
292,937 |
Disbursed, not yet PIF / CHGOFF / cancelled |
CANCLD |
~236,000 |
Cancelled |
CHGOFF |
216,123 |
Charged off |
COMMIT |
23,692 |
Approved, not yet disbursed |
The data dictionary's exact language for EXEMPT:
EXEMPT = The status of loans that have been disbursed but have not been cancelled, paid in full, or charged off are exempt from disclosure under FOIA Exemption 4.
That dictionary entry is still live. It was last updated in August 2018. The data file caught up in April 2026.
The new release breaks EXEMPT apart into seven sub-statuses:
| New code | Count (Mar 2026) | What it tells you |
|---|---|---|
CURR |
260,896 |
Currently performing |
PURCH(NOT C/O) |
14,404 |
SBA purchased the loan from the lender, not a charge-off |
LIQUID |
8,502 |
In liquidation |
DELINQ |
5,502 |
Delinquent |
PSTDUE |
2,670 |
Past due |
SOLDNC |
2,083 |
Sold, not yet charged off |
DEFERD |
730 |
Deferred |
To check that these really came out of EXEMPT and not somewhere else, we sampled 500 loans from each new sub-status, joined back to the December 2025 release on (location_id, approval_date, gross_approval), and looked at what their old LoanStatus was. Match rates ran 92-99%. For all seven of these codes, between 95-97% of matched loans had been coded EXEMPT in December. The remaining few percent were PIF, COMMIT, or CANCLD, which is small label drift between snapshots rather than a different bucket.
(CLSLN and SOLDCO, the other two new codes, came out of CHGOFF instead. More on that below.)
8,172 active 7(a) loans are currently DELINQ or PSTDUE. That number was zero in the prior release. The loans existed; they just weren't separately labeled.
If you have been triangulating SBA portfolio quality from chargeoff filings and lender 10-Qs, you can now skip the triangulation. The lender ranking on current distress is right there in the file.
The chargeoff count fell, but that is not the story
The 7(a) CHGOFF count fell by 73,225 between the December 2025 and March 2026 releases, from 216,123 to 142,898. That sounds dramatic. It is mostly a labelling effect.
The drop maps onto two new sub-statuses:
CLSLN(75,522): closed loans, mostly post-charge-off workouts and settlementsSOLDCO(309): sold charge-offs
The same row-level lookup confirms the migration. Of 500 CLSLN loans sampled, 87% had been coded CHGOFF in December and 12% had been coded PIF. Of the 309 SOLDCO loans (the full population), 90% were CHGOFF and 8% were PIF. About 10% of the new CLSLN and SOLDCO rows came from loans the SBA had previously called paid in full. They got reclassified as closed-after-workout or sold-as-charged-off, which is a different story than "paid in full."
A simple year-over-year chargeoff trend across releases will look like a 34% drop. Anyone comparing chargeoff rates between December and March needs to combine CHGOFF + CLSLN + SOLDCO to get a like-for-like number. The real signal is closer to flat, with cleaner classification.
Two smaller details worth flagging
PIF was renamed to P I F. The string now contains embedded spaces. If you have a SQL query, ETL job, or downstream model that pattern-matches on 'PIF' exactly, it will silently match zero rows on the new 7(a) data. The 504 file still uses 'PIF' without spaces.
The 504 program is still on the legacy 5-code taxonomy. No DELINQ, PSTDUE, CURR, LIQUID, or CLSLN codes appear on the 504 side of this release. So 504 lender delinquency is not yet visible at the loan level. SBA may roll the new codes to 504 in a future quarter. For now, lender-level distress comparisons across 7(a) and 504 are not apples-to-apples.
Why it matters for ABS investors and SBA lenders
For SBA loan-data consumers, the file is suddenly more useful. Until now, EXEMPT was a black box. It included currently performing loans, deferred loans, loans in workout, and loans actively in liquidation, all in one bucket. You could not rank lenders on current borrower distress from this file. You can now.
Anyone running a chargeoff rate trend across SBA quarterly releases also needs to recalibrate. A model trained on LoanStatus = 'CHGOFF' will see a count drop that does not reflect actual portfolio improvement. Combining CHGOFF + CLSLN + SOLDCO (the three post-chargeoff lifecycle states) will be more stable across the taxonomy break.
Back to the lender chart. Huntington's 6.0% rate sits on the largest 7(a) book in the country. The next-highest top-20 lender by rate is Newtek at 4.3%, on a much smaller $2.1B active book. KeyBank, which led on a count-weighted version of this metric at 5.7%, falls to 1.7% once weighted by approval dollars. Their delinquencies are concentrated in smaller-ticket loans.
Methodology and caveats
This analysis uses the SBA FOIA bulk data, snapshot 2026-03-31, ingested April 29.
The active book is loans where LoanStatus is CURR, DELINQ, PSTDUE, or DEFERD. Those are the four codes for loans currently being serviced: disbursed, not yet paid off, not charged off, not cancelled, not sold. LIQUID and CLSLN are excluded because both are workout endpoints, not active servicing. The delinquency numerator is the subset that is DELINQ or PSTDUE.
Both numerator and denominator are weighted by GrossApproval, the original approved amount. SBA FOIA does not disclose current outstanding balance, so older loans are weighted at their original size even after most of the principal has paid down. A current-balance-weighted version would shrink the long tail. The relative ranking of lenders should hold under that adjustment, but the absolute rates would move.
The 20 lenders shown are the largest by GrossApproval in active servicing. The worst delinquency rates in the dataset belong to smaller lenders with thin books; this chart isn't trying to surface those.
504 is out of scope here. The 504 side of this release does not yet include the new sub-statuses, so loan-level 504 delinquency remains undisclosed.
If you want the loan-level file behind this analysis, with LoanStatus, LenderName, BorrName, NaicsCode, ProjectState, GrossApproval, and the disbursement and chargeoff date fields, it is part of the SBA loan data subscription. For broader SBA program coverage including 504, see the SBA 7(a) and SBA 504 dataset pages.
The next SBA quarterly drop should land around July 2026. Worth watching: whether 504 picks up the new sub-statuses, whether the P I F formatting reverts, and whether Huntington's delinquency rate is actually moving, or whether 6.0% is just where their book sits.