SBA Industry Delinquency: Trucking Leads, Restaurants Carry the Biggest Dollar Exposure
In an earlier post today, we walked through what changed in the April 2026 SBA FOIA release: loan-level delinquency is now public for the first time. That post ranked the 20 largest SBA 7(a) lenders. This one cuts the same data by NAICS industry sector.
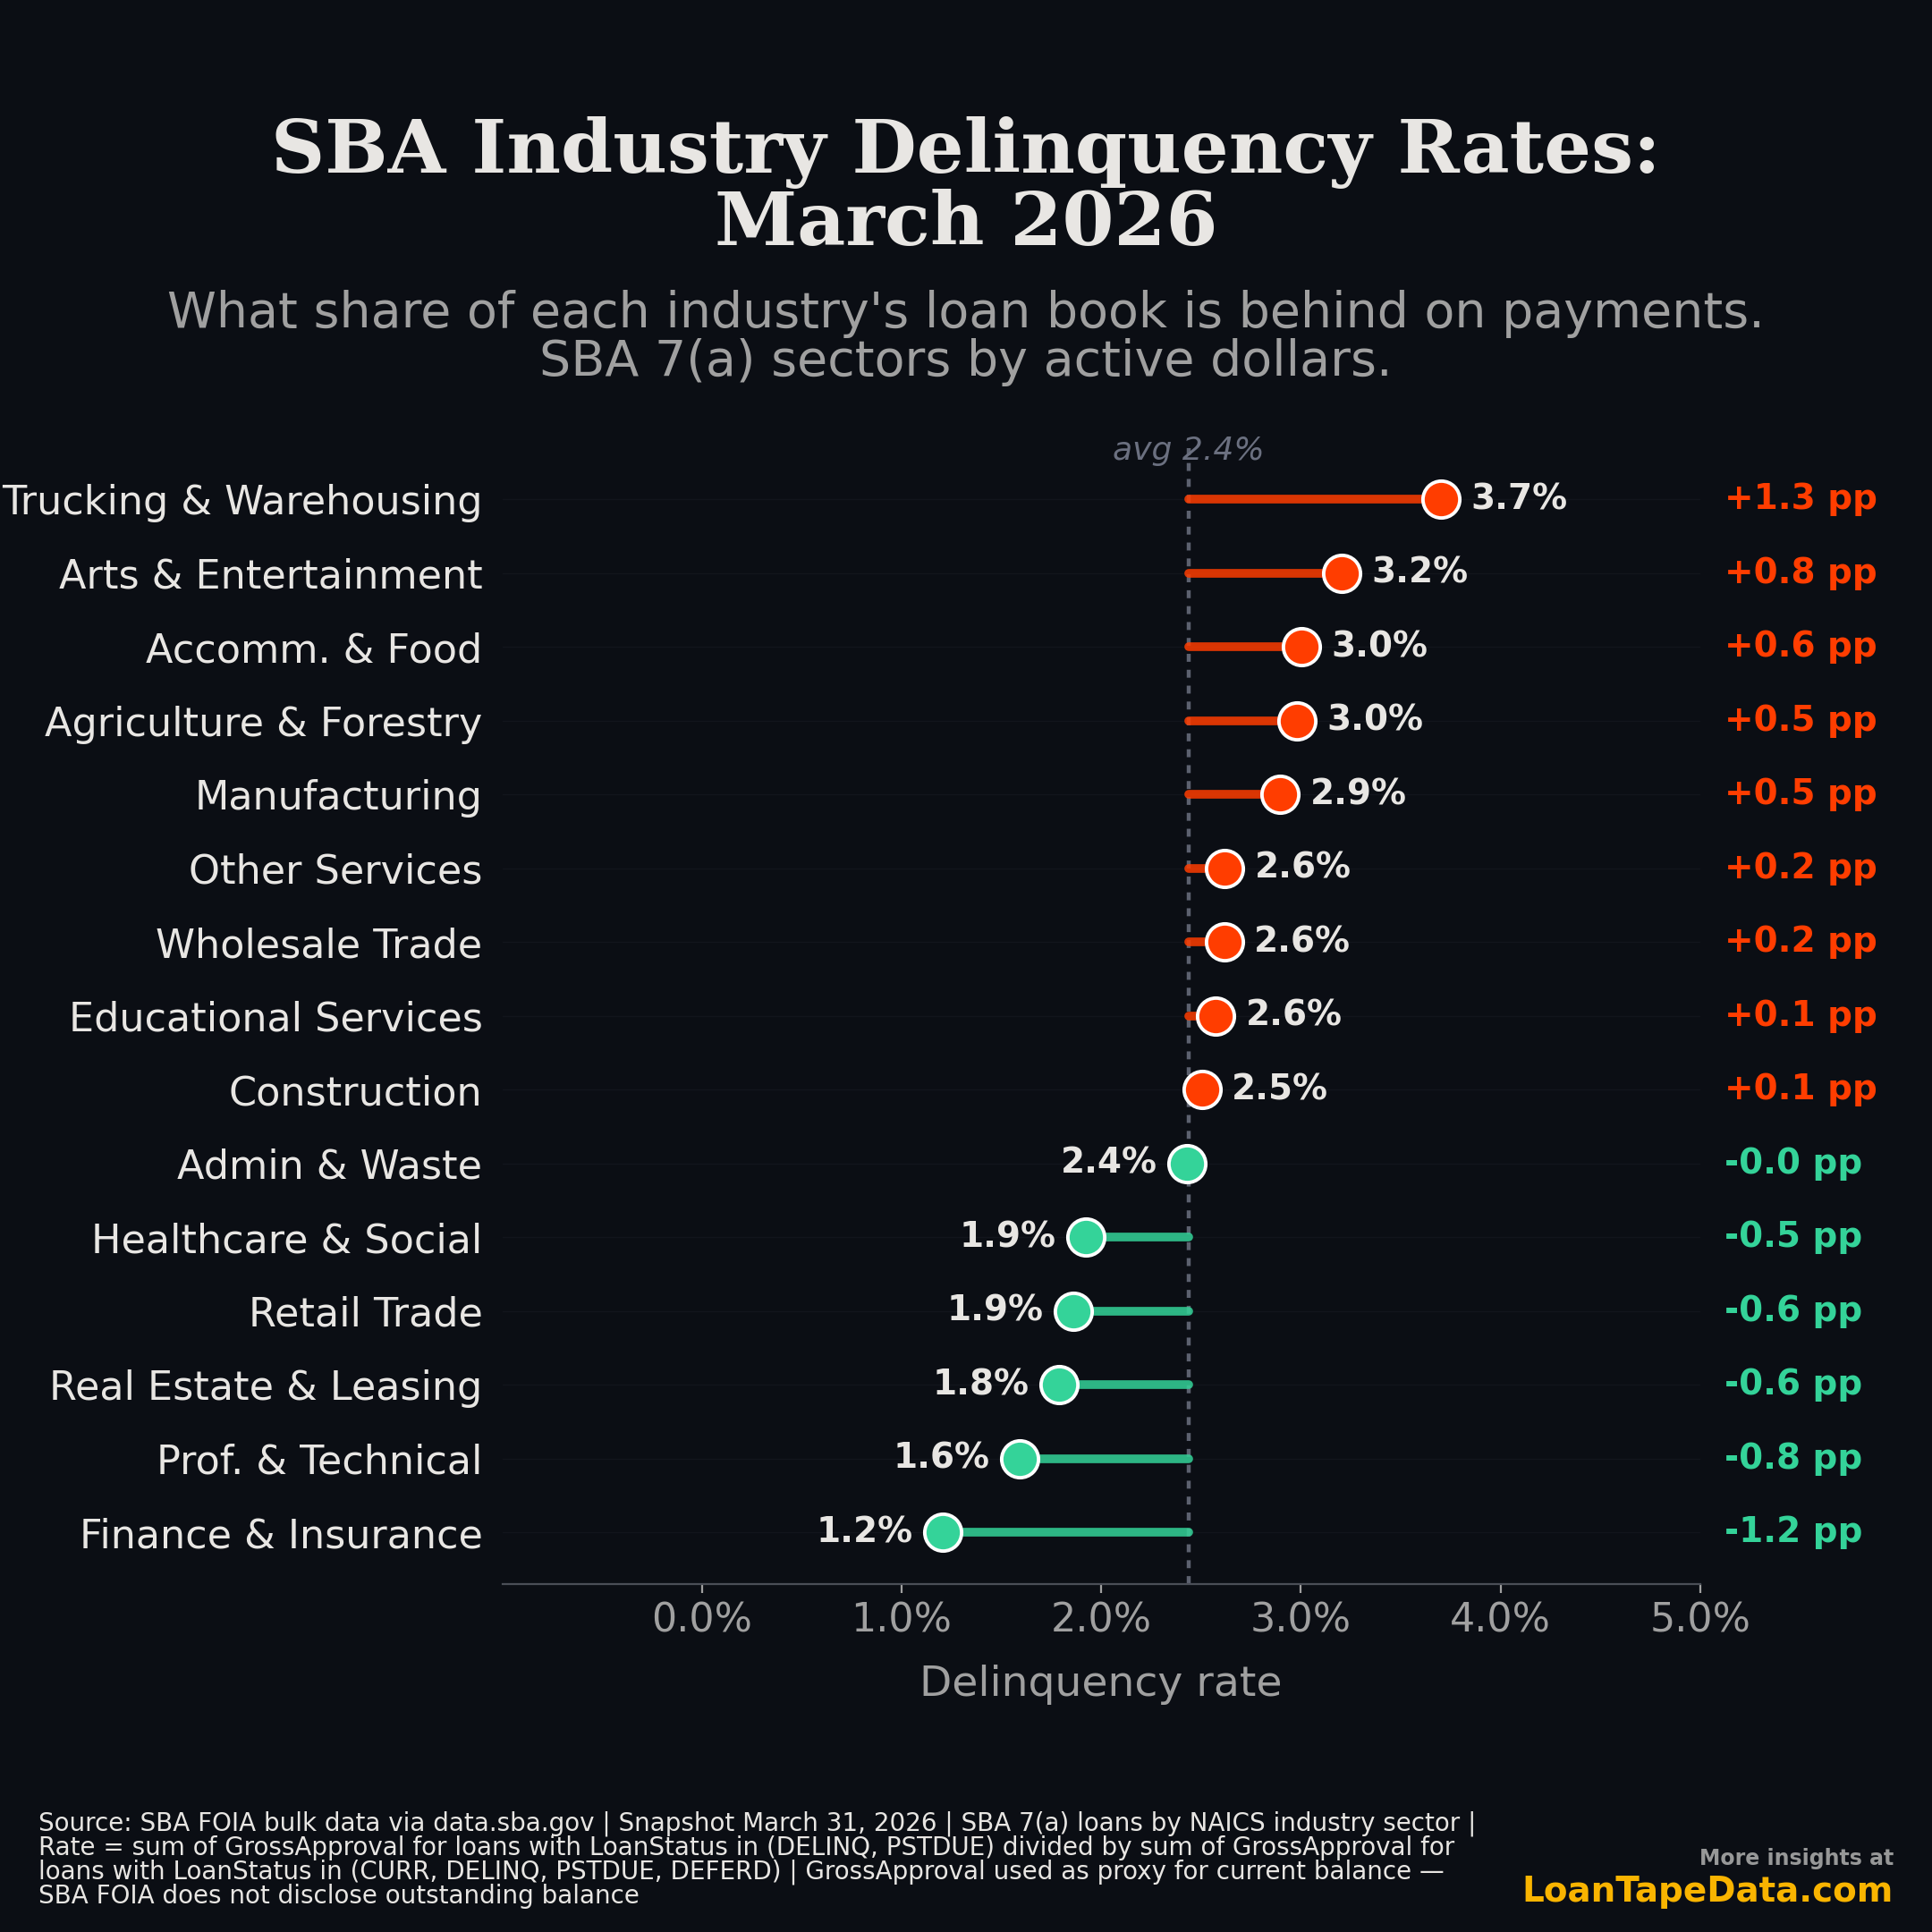
What the chart shows
Across 15 major NAICS sectors with at least $1.5B of active SBA 7(a) servicing, the dollar-weighted delinquency rate is 2.4%. Trucking and Warehousing is the highest at 3.7%. Finance and Insurance is the lowest at 1.2%.
| Rank | Sector | Delinquency rate | Past-due $ | Active book |
|---|---|---|---|---|
| 1 | Trucking & Warehousing | 3.7% |
$161M |
$4.4B |
| 2 | Arts & Entertainment | 3.2% |
$166M |
$5.2B |
| 3 | Accomm. & Food | 3.0% |
$829M |
$27.6B |
| 4 | Agriculture & Forestry | 3.0% |
$72M |
$2.4B |
| 5 | Manufacturing | 2.9% |
$350M |
$12.1B |
| ... | ... | ... | ... | ... |
| 13 | Real Estate & Leasing | 1.8% |
$70M |
$3.9B |
| 14 | Prof. & Technical | 1.6% |
$184M |
$11.6B |
| 15 | Finance & Insurance | 1.2% |
$29M |
$2.4B |
Trucking's 3.7% rate is 54% above the SBA-wide average and consistent with what freight-rate watchers have been talking about for the past two years. The post-2022 freight recession compressed margins for owner-operators and small fleets, and small-business SBA loans tend to fund exactly that segment of trucking.
The biggest dollar exposure is in restaurants, not trucking
A rate is one view. A dollar exposure is another. Accommodation and Food Services carries $829M of past-due loans against a $27.6B active book. That is more than 5x Trucking's past-due dollar volume, despite a lower rate.
Sorted by absolute past-due dollars, the picture inverts:
| Rank by $ past-due | Sector | Past-due $ | Rate |
|---|---|---|---|
| 1 | Accomm. & Food | $829M |
3.0% |
| 2 | Retail Trade | $397M |
1.9% |
| 3 | Other Services | $354M |
2.6% |
| 4 | Healthcare & Social | $350M |
1.9% |
| 5 | Manufacturing | $350M |
2.9% |
For an investor or lender thinking about portfolio concentration, the highest-rate sectors are not the same as the highest-dollar sectors. Restaurants, hotels, and motels are the single largest source of past-due SBA dollars in absolute terms, even with their rate sitting close to the average.
Where the cleanest books live
Finance and Insurance is the cleanest at 1.2%, about half the SBA-wide rate. Professional, Scientific, and Technical Services is 1.6%. Real Estate and Rental and Leasing is 1.8%. These are sectors with relatively predictable cash flow, lower fixed-cost exposure, and borrowers who tend to be better-capitalized at SBA scale.
Healthcare and Social Assistance comes in at 1.9% despite being one of the larger sector books at $18.2B of active servicing. Of the high-volume sectors, Healthcare is the cleanest.
What this view doesn't capture
A few things to keep in mind before reading the chart as a definitive sector ranking.
The rate is dollar-weighted using GrossApproval, the original approved loan amount. SBA FOIA does not disclose current outstanding balance, so a loan from 2010 with 90% of its principal already paid down is still being weighted at its 2010 size. Older sectors with more mature books look slightly worse than they would on a current-balance basis.
We dropped four sectors with active books below $1.5B: Mining and Oil/Gas, Utilities, Information, and Management of Companies. Each of those had headline rates of 4-5% on the dollar-weighted view, but with $150M-$1.2B of active servicing, a handful of large bad loans drives the rate. Those sectors are real but not statistically robust at this denominator size.
The denominator is loans currently in active servicing, meaning LoanStatus of CURR, DELINQ, PSTDUE, or DEFERD. Charged-off, paid-in-full, cancelled, and liquidating loans are excluded from both numerator and denominator. The numerator is DELINQ + PSTDUE.
What it means for portfolio construction
If you are building or stress-testing an SBA loan portfolio, two practical reads come out of this chart.
First, sector matters more than headline rates suggest. The spread between Trucking at 3.7% and Finance at 1.2% is roughly 3x. A book heavy in Trucking, Arts, Accommodation, Agriculture, or Manufacturing is materially riskier on current-distress terms than one tilted toward Finance, Professional Services, or Real Estate.
Second, the absolute exposure tail is concentrated. Restaurant and hospitality SBA debt is the single biggest past-due bucket in the FOIA data, with $829M of it currently behind on payments. That is 19% of all dollar-weighted SBA 7(a) past-due exposure across the sectors we ranked.
For the loan-level file behind this analysis, including LoanStatus, LenderName, BorrName, NaicsCode, ProjectState, and GrossApproval, see the SBA loan data subscription. For the broader SBA 7(a) and SBA 504 program coverage, see the dataset pages.
The next SBA quarterly release should land around July 2026. Worth tracking sector-by-sector: whether trucking eases as freight rates recover, whether the hospitality dollar exposure moves, and whether the cleanest sectors stay clean.