The Buy-vs-Build Gap Is Mostly a Sub-$1M Story in SBA Lending
In the last SBA post, I looked at chargeoff rates by business age and found the broad pattern most search-fund people expect: loans tied to buying an existing business usually performed better than startup loans. That result still holds. It just looks a lot less dramatic once loan size enters the picture.
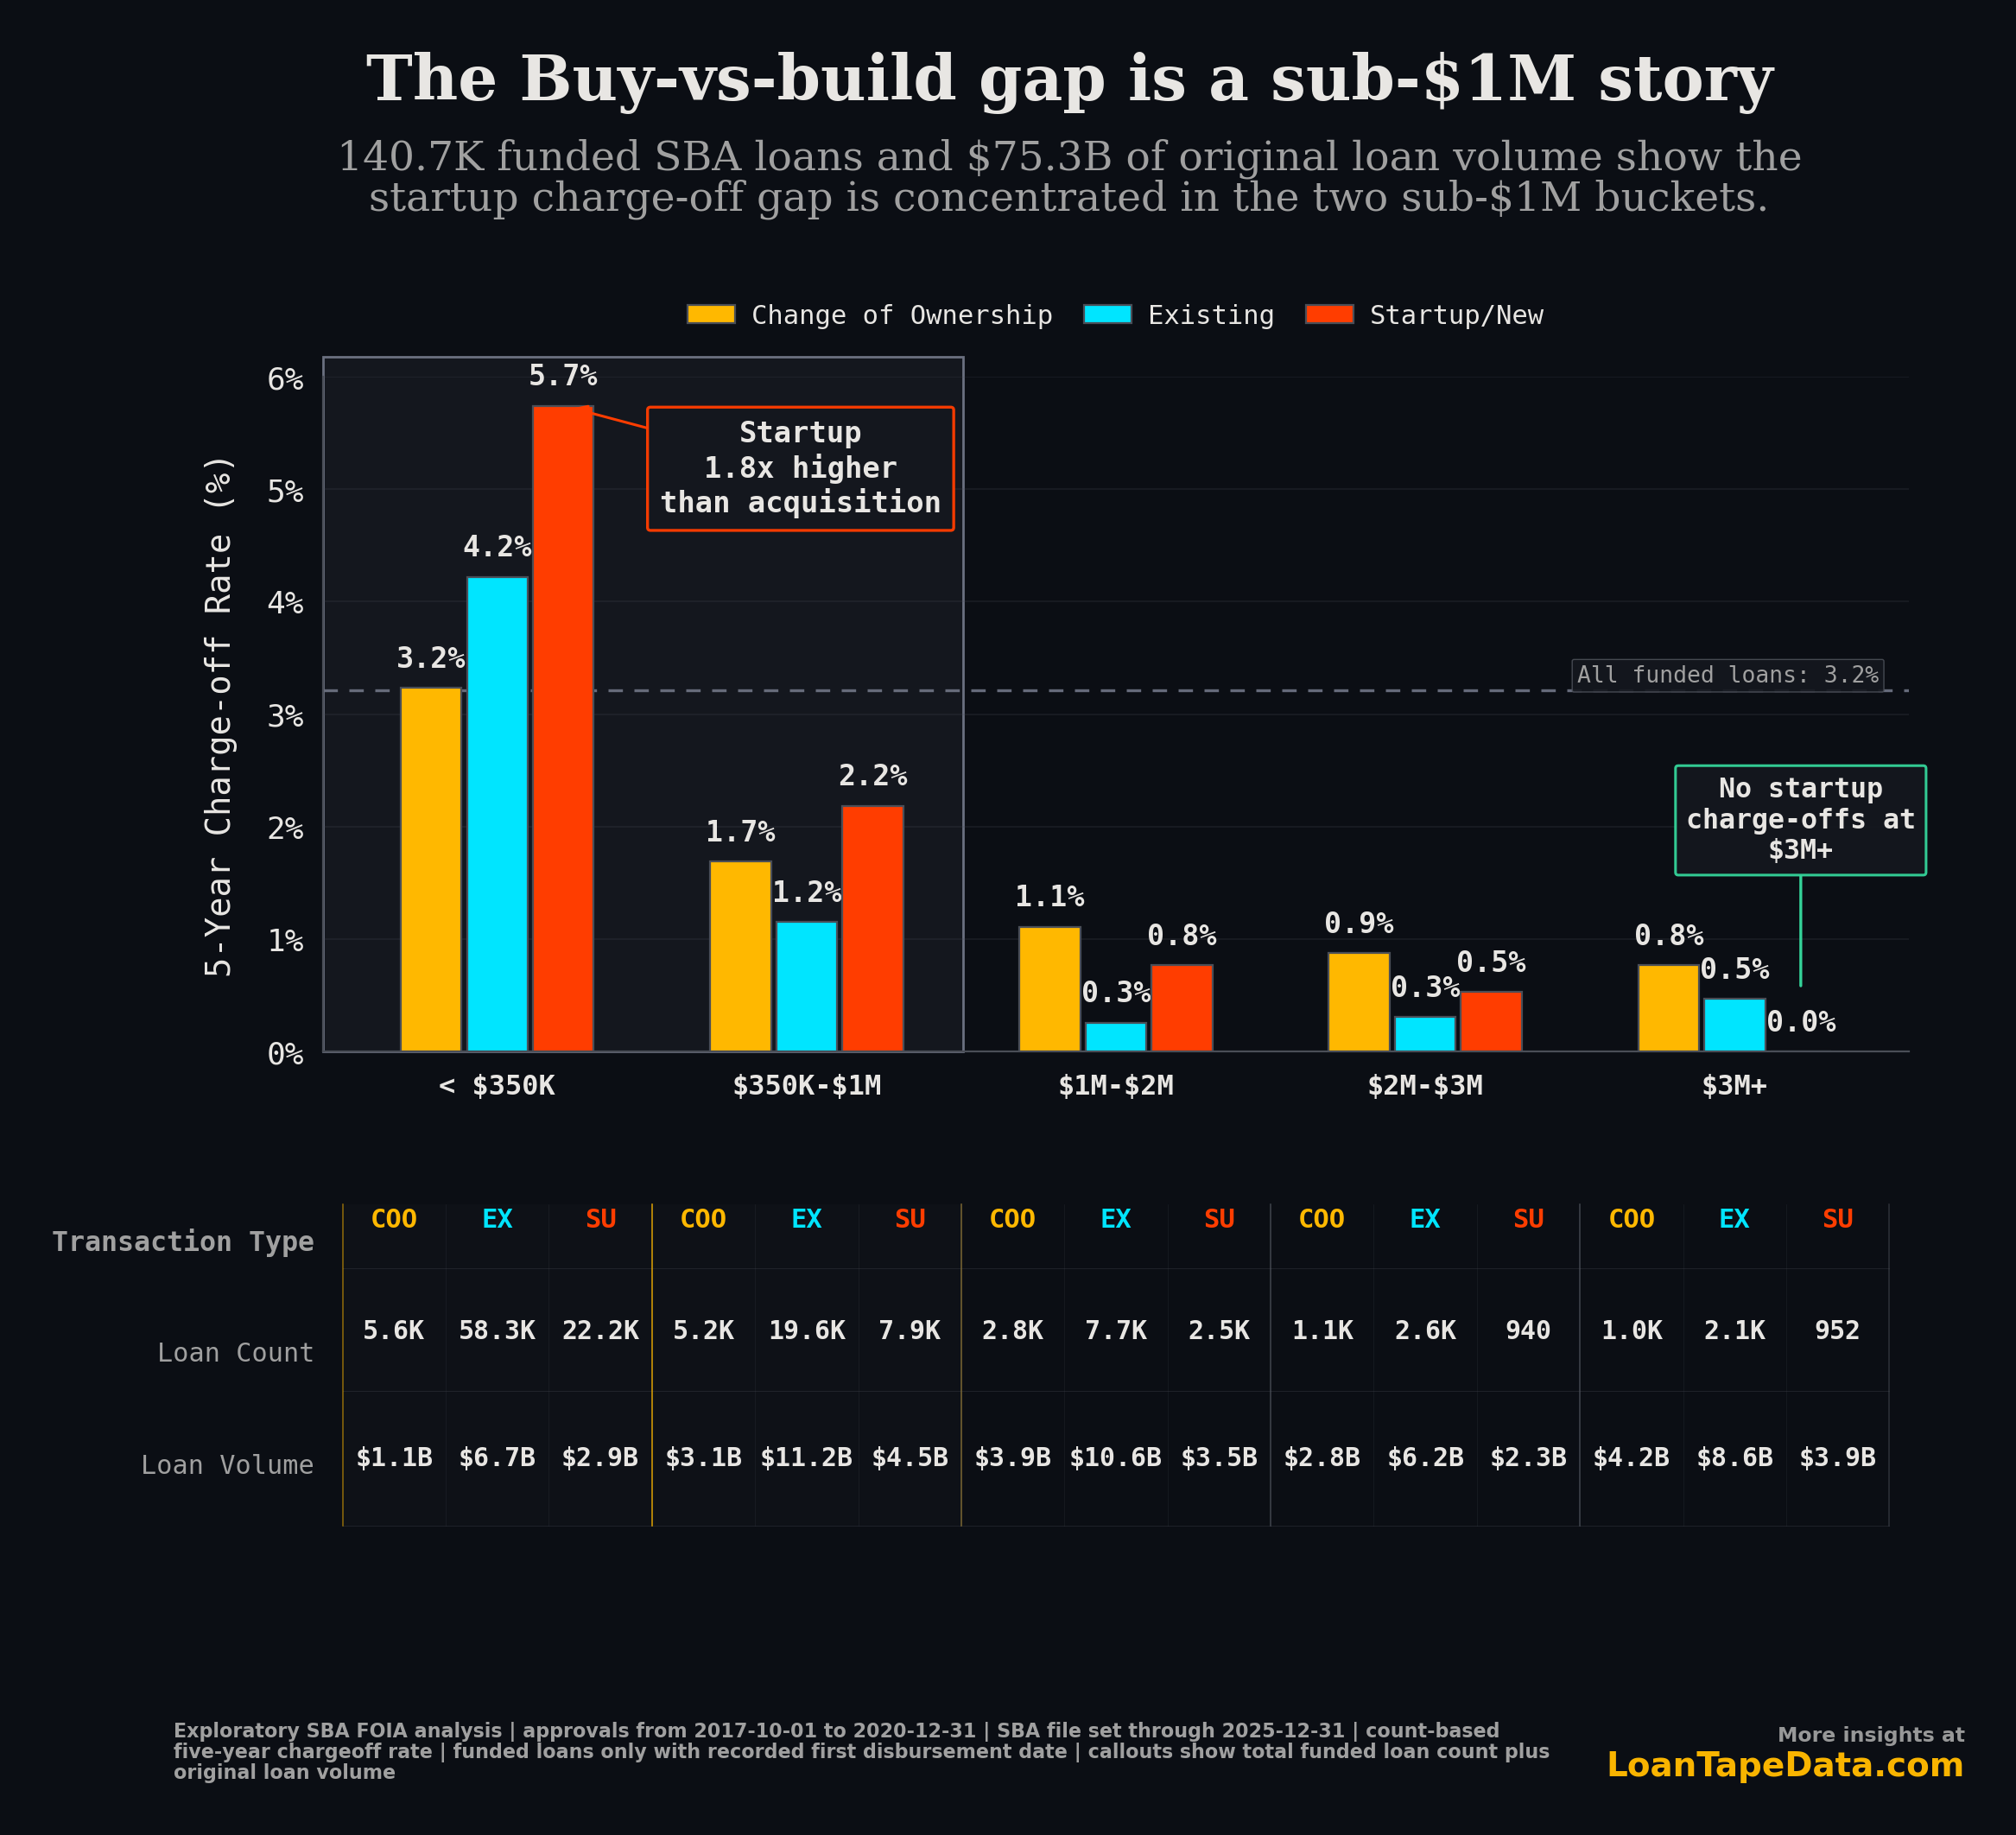
Across 140,696 funded SBA loans totaling $75.3B of original loan volume, the five-year chargeoff rate was 3.2% by loan count. The interesting part is where the spread lives. Most of it sits below $1M.
Where the gap actually shows up
- Under
$350K,Startup/Newloans charged off at5.7%, versus3.2%forChange of Ownership. - In
$350K-$1M, startups were still worse at2.2%, versus1.7%. - By
$1M-$2M, the gap flipped in this cohort: startups were at0.8%, acquisitions at1.1%. - At
$3M+, startup loans had no chargeoffs inside the five-year window.
If you only look at blended averages, it is easy to tell a simple story: buying is safer than building. The size split shows something more useful. The acquisition edge is real, but a lot of it comes from the smaller end of the market.
Why size changes the story
Loan size is not just a financing detail. In SBA lending, it usually comes with a different kind of borrower, a different underwriting process, and a different margin for error.
Small loans tend to have thinner cushions. There is less room to absorb a bad first year, a slow ramp, or a customer concentration problem. That is where startup risk shows up most clearly.
Once you move into seven-figure SBA loans, the market looks different. Borrowers are usually stronger. Lenders are more selective. The transaction has more structure around it. At that point, "buy is safer than build" is still directionally true in the aggregate, but it stops being a very precise way to describe the risk.
What this chart is measuring
The SBA file does not say "search fund," "independent sponsor," or "bootstrap startup." It does give us a usable proxy through business_age:
Change of Ownershipis the closest SBA proxy for acquisition activity.Existingcovers operating businesses that were not coded as change-of-ownership deals.Startup/Newcovers newly started businesses.
That is not legal deal taxonomy. It is an SBA operating label. For this question, it is enough.
The practical read
If you are underwriting, brokering, or buying SBA-backed deals, start with size before you start making broad claims about transaction type.
- Below
$1M, startup loans are a clearly different risk pool. - Above
$1M, the spread narrows fast enough that industry, structure, and sponsor quality start to matter more. - Blended default rates can hide that size mix.
That is the part most quick SBA commentary misses. Acquisition loans skew larger. If larger loans sit in a lower-loss part of the market, then some of the acquisition advantage is really a size-mix story.
Methodology
This chart uses the same fixed-horizon cohort as the earlier acquisition-versus-startup post:
- approvals from
2017-10-01through2020-12-31 - SBA file coverage through
2025-12-31 - funded loans only, requiring a recorded
first_disbursement_date - five-year cumulative chargeoff rate by loan count
This uses the same SBA FOIA file coverage behind the broader industry chargeoff analysis. If you want the full loan-level file with program, industry, geography, and status fields, it is part of the SBA loan data subscription.
One caveat is worth keeping in view. The $3M+ startup bucket showed 0.0% chargeoffs in this cohort and this five-year window. That is a real zero in the sample, not a rounding quirk. It is not a claim about every SBA cycle.
If you want the cleanest version of the finding, it is this: the buy-vs-build gap in SBA lending is mostly a sub-$1M story. Above that, you need a more careful explanation than the usual talking point.