Buying Is Usually Safer Than Starting: SBA Chargeoff Rates by Business Age
Entrepreneurship Through Acquisition, or ETA, and search-fund people keep circling back to the same question: is it better to buy a business or build one? If you buy a business with real customers, real staff, and real cash flow, you start from a very different place than someone trying to build all of that from scratch.
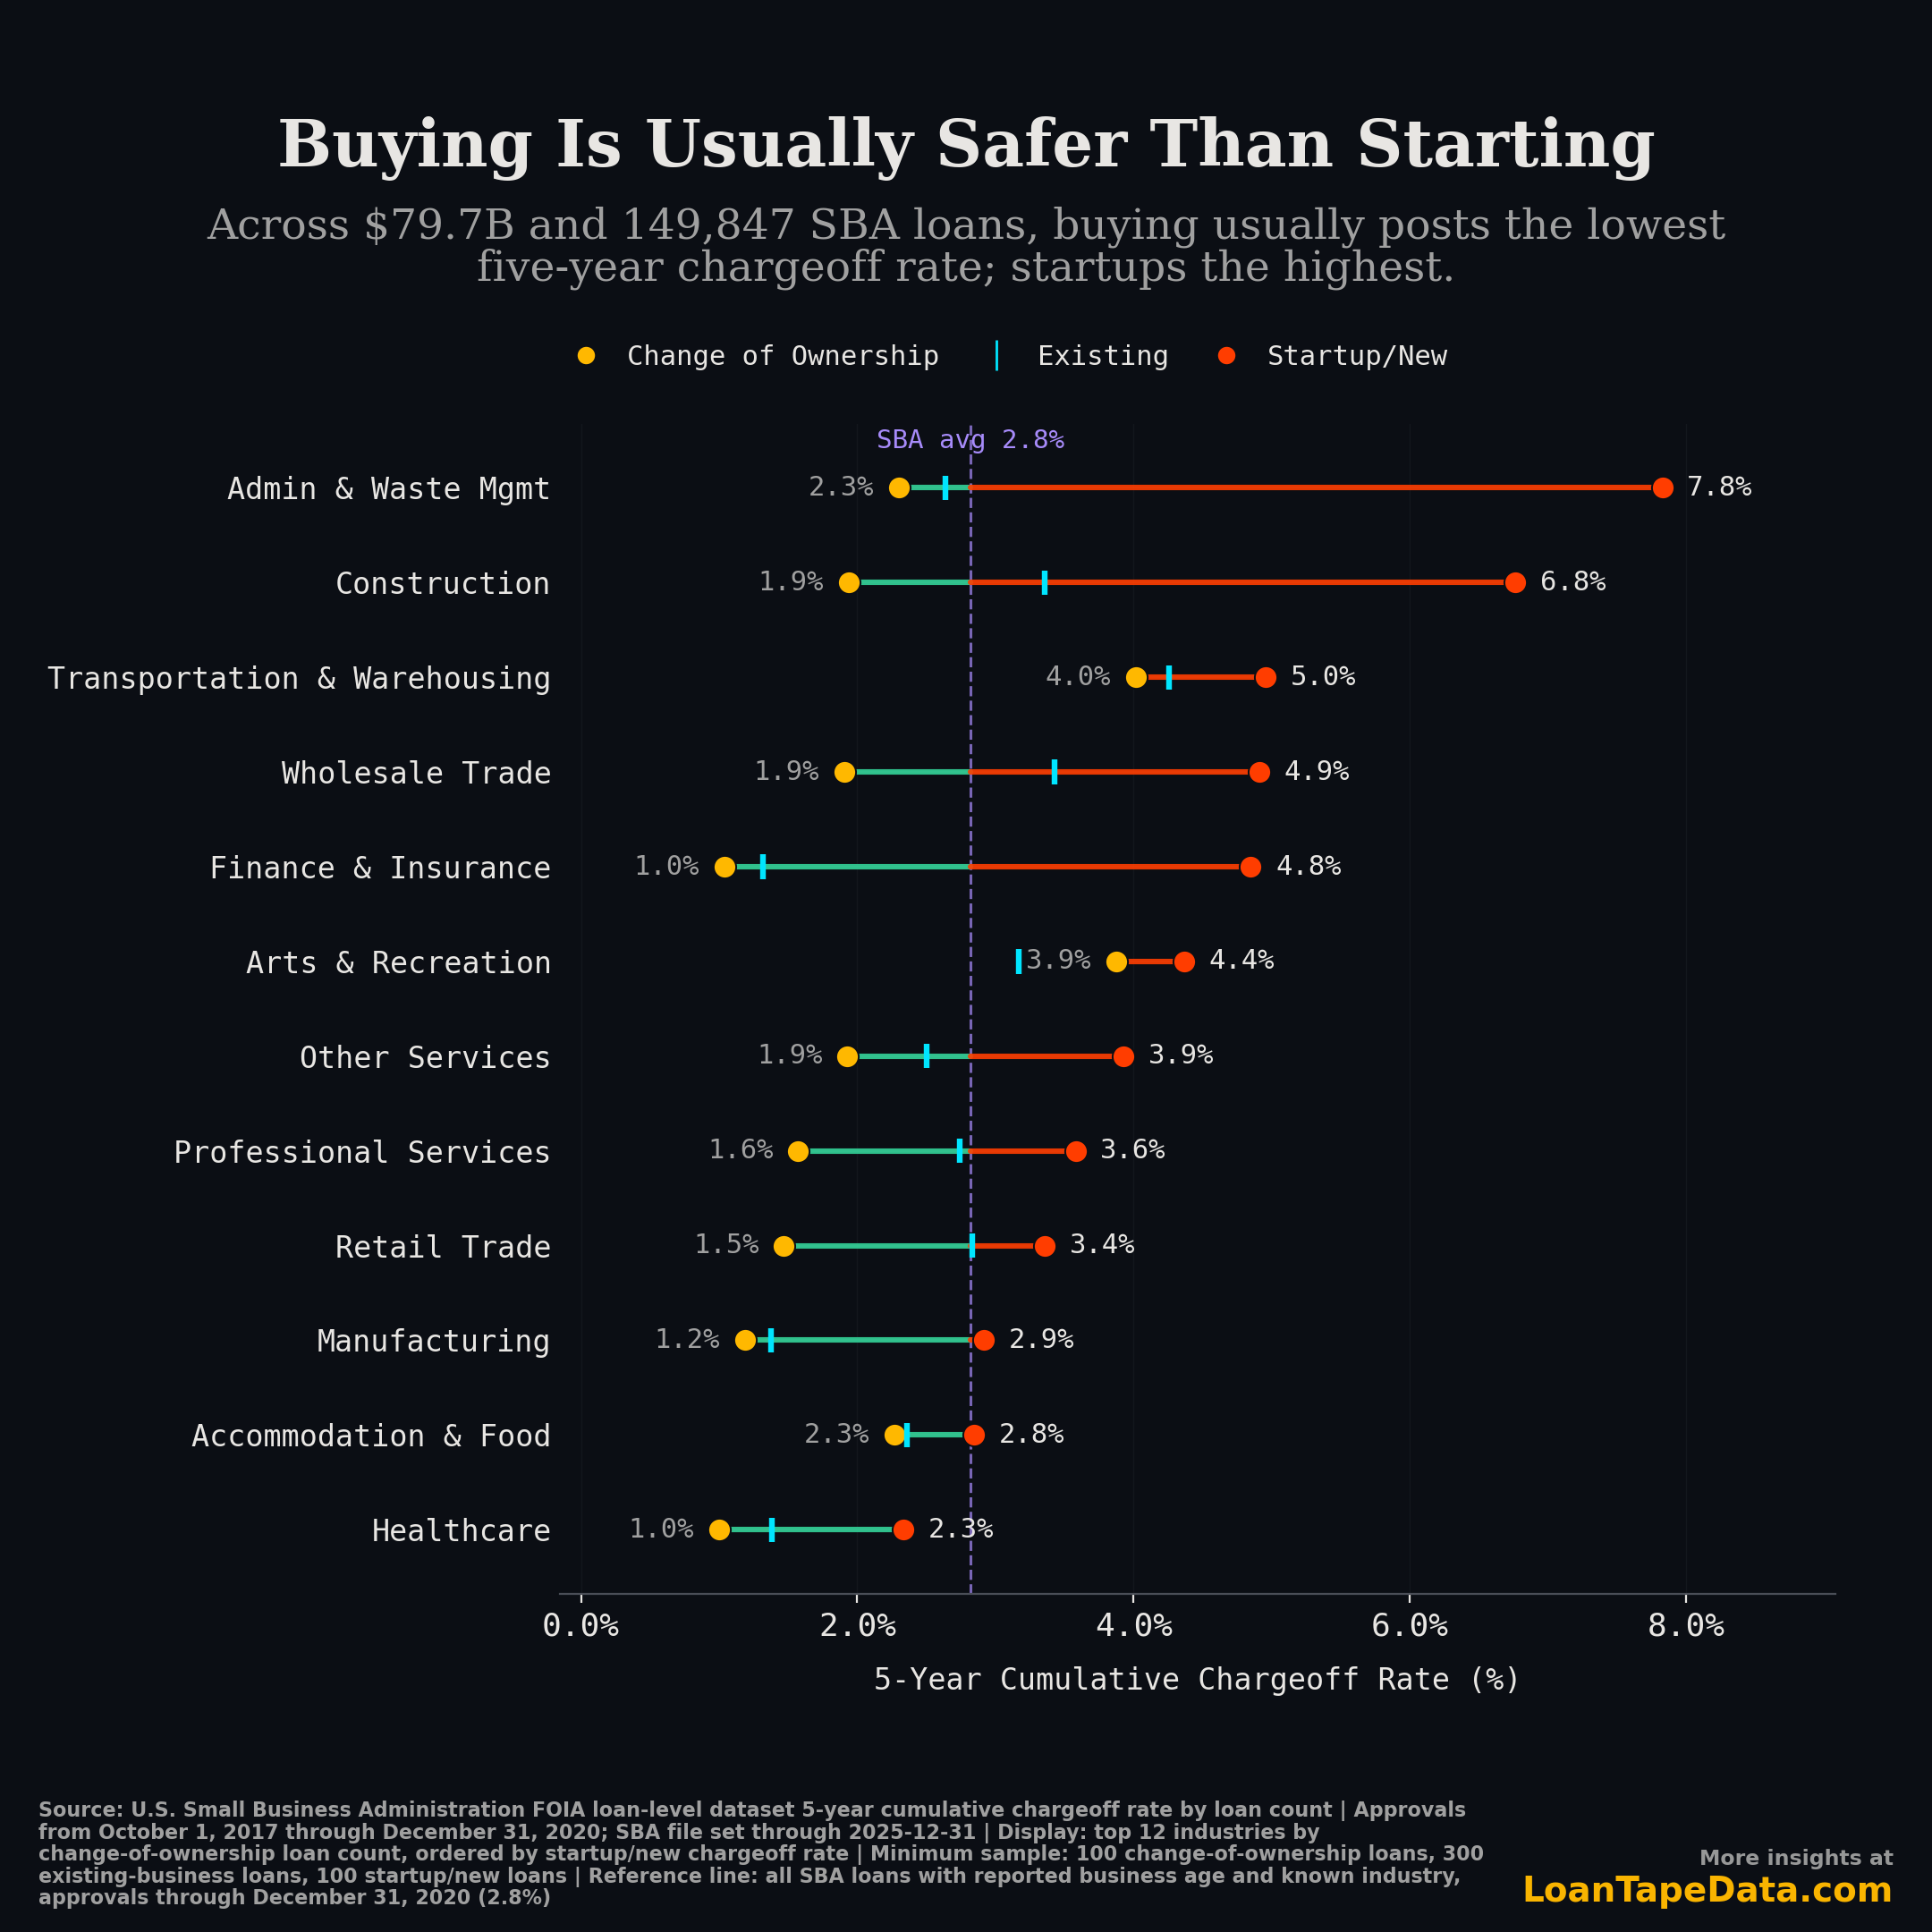
The SBA file cannot tell you whether buying a business will make anyone rich. But it can tell you something narrower, and usually more useful at the start of a deal: the base rate. Base rates matter because they tell you what tends to happen before you get lost in the specifics of one CIM, one management call, or one seller story. Across 149,847 loans totaling $79.7 billion, the SBA's "Change of Ownership" loans posted lower five-year chargeoff rates than "Startup/New" loans in every one of the 12 industries with enough volume to compare all three groups.
That will not shock people who already believe in buying cash flow. What got my attention is how cleanly it shows up in the data. Buying usually looks safer than starting. Industry still matters. And none of that means the job gets easier after closing.
What the chart says
Here is the short version. Within this 12-industry sample, the weighted five-year chargeoff rates came out to:
1.9%for acquisition loans2.7%for existing-business loans3.8%for startup loans
The benchmark line on the chart is 2.8%. That is the five-year chargeoff rate for all SBA loans in the same approval window with reported business_age and known industry. Acquisition loans came in below that line in 10 of the 12 plotted industries. Only one startup bucket beat it.
That is the part I keep coming back to. The acquisition bucket is not just a little better on average. In a few sectors, it is better by a lot.
Where buying helps the most
Here are the biggest acquisition-versus-startup gaps in the chart:
| Industry | Change of Ownership | Existing | Startup/New |
|---|---|---|---|
| Admin & Waste Mgmt | 2.3% | 2.6% | 7.8% |
| Construction | 1.9% | 3.4% | 6.8% |
| Wholesale Trade | 1.9% | 3.4% | 4.9% |
| Finance & Insurance | 1.0% | 1.3% | 4.8% |
| Professional Services | 1.6% | 2.7% | 3.6% |
Admin & Waste Management is the clearest example. Acquisition loans charged off at 2.3%. Startup loans came in at 7.8%. Same industry. Very different failure profile.
Construction is close behind: 1.9% for acquisitions, 3.4% for existing businesses, and 6.8% for startups. A contractor with crews, customers, and local relationships is a different credit from a first-time builder starting from zero.
Finance & Insurance stands out too. Acquisition loans charged off at 1.0%, existing businesses at 1.3%, and startups at 4.8%. The businesses that look easiest to start on paper may be the ones where operating history matters most.
Where the gap narrows
Buying helps. It does not erase sector risk.
Transportation & Warehousing was rough across the board: 4.0% for acquisitions, 4.3% for existing businesses, and 5.0% for startups. Accommodation & Food was tighter at 2.3%, 2.4%, and 2.8%. In both cases, buying helps, but it does not change the fact that these are tougher industries to lend into.
Arts & Recreation is the one plotted industry where existing businesses beat acquisitions: 3.2% versus 3.9%. Even there, startups were still worst at 4.4%.
That is why I like the three-bucket split instead of a simple buy-versus-build chart. You can see the broad pattern, but you can also see where the middle bucket behaves differently.
What the data does not show
This is where I would be careful with the conclusion.
The SBA file tells you about loan performance. It does not tell you what ownership feels like after the deal closes. It does not tell you whether the seller left you with deferred maintenance, whether your manager quits in month three, whether your biggest customer walks, or whether half the business depends on one employee who is already burned out.
So yes, buying looks safer than starting. The base rates lean that way. But "safer" is not the same thing as "easy." Small business ownership still has a lot of sharp edges, and the operating reality is harder than the chart can show.
How I measured it
This is a fixed-horizon cut, not a lifetime-loss snapshot. For each loan, I asked one question: did it charge off within five years of approval? That keeps a fresh 2024 loan from sitting in the same denominator as a fully seasoned 2017 loan.
The plotted sample uses:
- approvals from
2017-10-01through2020-12-31 - file coverage through
2025-12-31, so every loan has a full five-year observation window - the top
12industries byChange of Ownershiploan count after filters - minimum sample sizes of
100acquisition loans,300existing-business loans, and100startup loans per industry
This uses the same SBA FOIA loan files behind the broader industry chargeoff analysis and the later sector volatility analysis. If you want the full loan-level file with program, industry, geography, and status fields, it is part of the SBA loan data subscription.
The caveats that matter
This is still exploratory work, so the caveats matter:
business_ageis a modern-vintage SBA field in practice, not a clean 20-year historical dimensionChange of Ownershipis an SBA program/status proxy for acquisition activity, not a legal M&A taxonomy- this is strongest as a recent-vintage, fully seasoned SBA pattern, not a claim about every historical lending cycle
I would not read this as "buying is always safe." I would read it this way: in recent, fully seasoned SBA vintages, loans tied to buying an operating business usually performed better than loans backing a startup.
If you are a self-funded searcher, a lender, or a broker, that is useful to know. It will not underwrite the deal for you, and it will not make the operating job gentler. It does tell you which way the base rates lean.