Franchise Restaurants Look Riskier for SBA Lenders
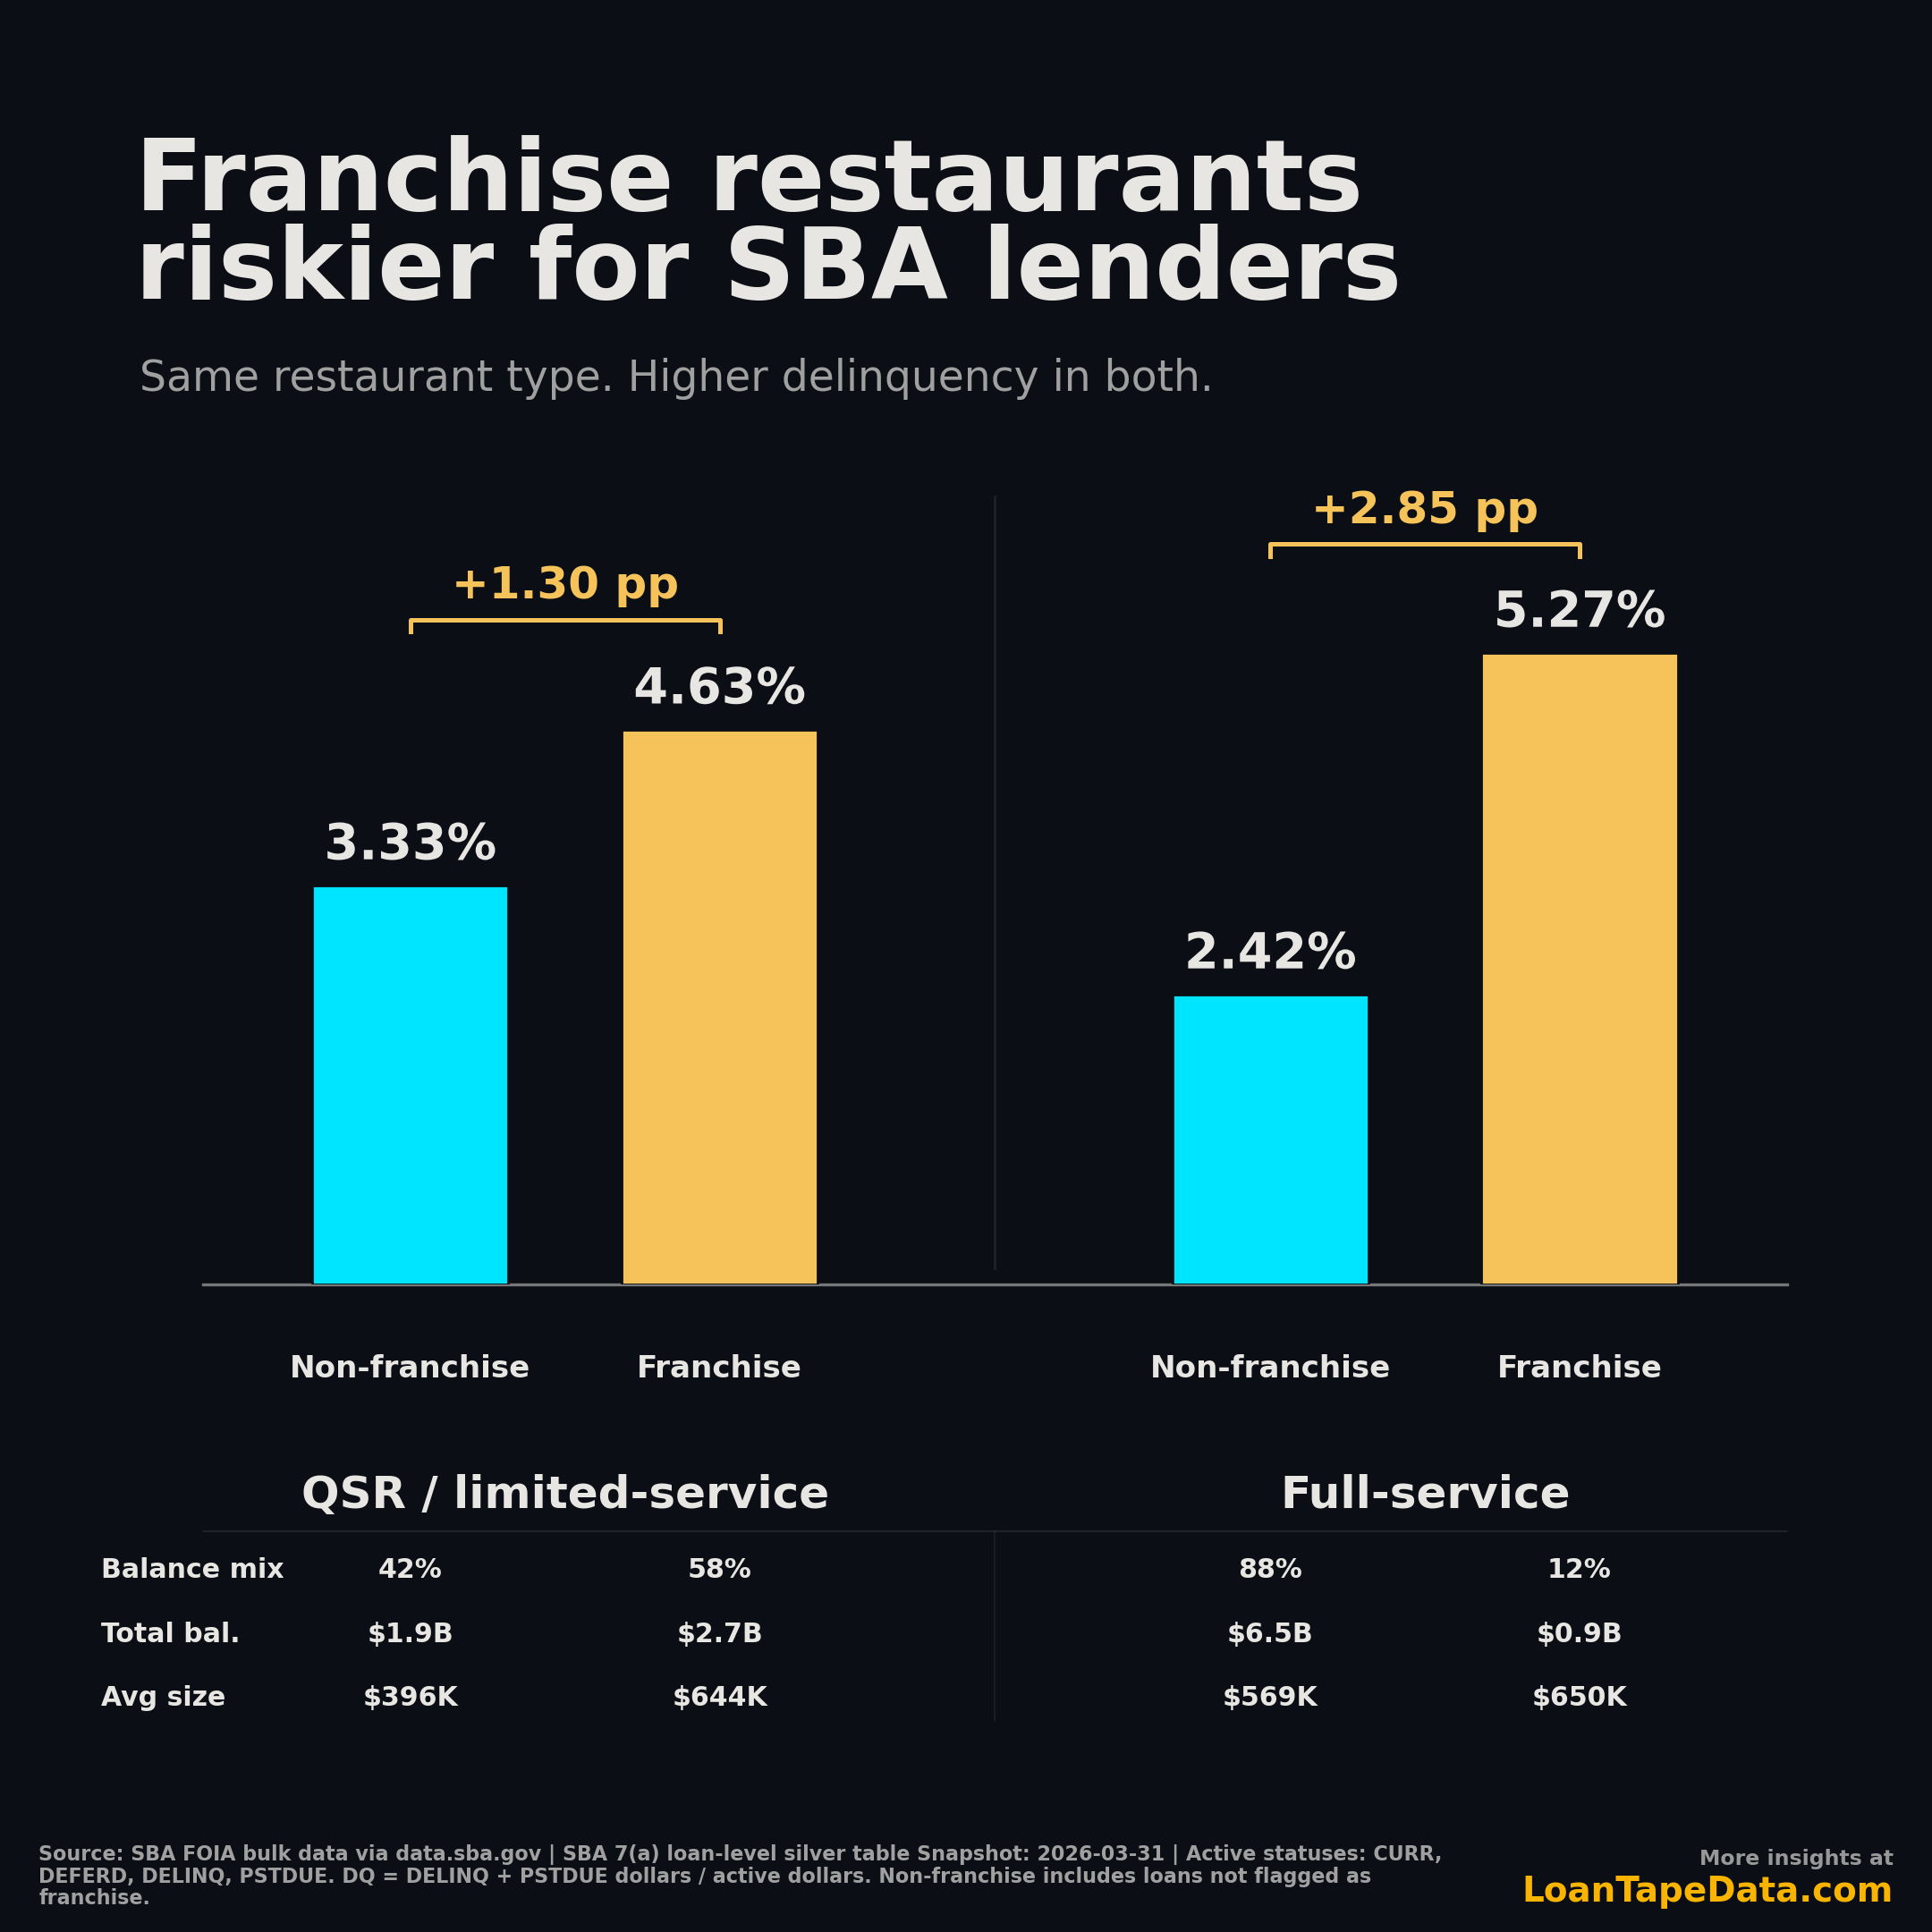
Franchise full-service restaurant loans are delinquent at 5.27% of active SBA dollars, more than double the 2.42% rate for non-franchise full-service restaurants. In QSR and limited-service restaurants, the franchise gap is smaller but still clear: 4.63% versus 3.33%.
That is the non-obvious read. The franchise label is not acting like a safety blanket in the latest active SBA restaurant book. It is attached to higher delinquency in both restaurant formats.
The simple read
The chart compares two restaurant categories from the SBA 7(a) active book:
NAICS 722513, limited-service restaurants, shown here as QSR / limited-serviceNAICS 722511, full-service restaurants
The first thing you notice is the format split. QSR / limited-service restaurants are running a blended 4.09% dollar-weighted delinquency rate. Full-service restaurants are lower at 2.76%.
That comparison is true, but it is not the more useful finding. The franchise split sits inside both restaurant formats:
| Restaurant format | Non-franchise DQ rate | Franchise DQ rate | Franchise gap |
|---|---|---|---|
| QSR / limited-service | 3.33% |
4.63% |
+1.30 pp |
| Full-service restaurants | 2.42% |
5.27% |
+2.85 pp |
The broad QSR-versus-full-service comparison tells you which restaurant format is more delinquent on a blended basis. The franchise comparison tells you something sharper for underwriting: within the same restaurant format, franchise loans are worse in this snapshot.
That is not the usual way people talk about restaurant lending. In deal conversations, franchise affiliation often reads like a form of validation. The brand exists. The playbook exists. The menu, signage, systems, and vendor relationships are already defined. That can matter operationally. But in this SBA cut, the current delinquency rate is higher for the loans flagged as franchise.
Balance mix changes the interpretation
The balance mix is what keeps this from being a simple "franchise bad, non-franchise good" chart.
| Restaurant format | Franchise flag | DQ rate | Balance mix | Active balance | Avg loan size |
|---|---|---|---|---|---|
| QSR / limited-service | Non-franchise | 3.33% |
42% |
$1.9B |
$396K |
| QSR / limited-service | Franchise | 4.63% |
58% |
$2.7B |
$644K |
| Full-service restaurants | Non-franchise | 2.42% |
88% |
$6.5B |
$569K |
| Full-service restaurants | Franchise | 5.27% |
12% |
$0.9B |
$650K |
QSR / limited-service is the larger franchise exposure story. Franchise loans make up 58% of active QSR dollars and average $644K, compared with $396K for non-franchise QSR loans. That means the higher franchise delinquency rate is sitting on the larger side of the QSR balance pool.
Full-service is different. Franchise full-service loans have the highest delinquency rate in the chart at 5.27%, but they are only 12% of active full-service restaurant balance. Non-franchise full-service loans dominate the dollar base at $6.5B, and they are running a much lower 2.42% delinquency rate.
That mix explains why the full-service blended rate can still look calmer than QSR. The riskiest row in this cut is full-service franchise, but it is a small slice of full-service balance. The larger QSR problem is that franchise exposure is both higher delinquency and bigger balance share.
Across the four rows, the active restaurant balance in this cut is about $11.9B. The delinquent balance is about $390M. QSR / limited-service accounts for $4.5B of active balance and about $186M of delinquent balance. Full-service accounts for $7.4B of active balance and about $204M of delinquent balance.
Those are not tiny samples. This is a real exposure split, not a chart built on a few dozen loans.
The dashboard trap
If you stop at restaurant format, the dashboard answer is simple: QSR / limited-service is worse than full-service, 4.09% delinquent versus 2.76%. That is useful for a first pass, but it can push the credit conversation in the wrong direction.
The franchise split shows why. Full-service restaurants look better on a blended basis because non-franchise full-service loans are the dominant balance pool. They carry 88% of full-service dollars and run at 2.42% delinquency. The smaller franchise full-service pool is much weaker at 5.27%, but it does not have enough balance share to define the whole category.
QSR / limited-service has the opposite problem. The franchise side is not a small exception. It is 58% of active QSR dollars, and it is running 4.63% delinquent. That means a QSR portfolio review that ignores franchise status is mixing the larger and weaker franchise pool with the smaller and better-performing non-franchise pool.
For portfolio monitoring, the better cut is not restaurants, then maybe franchise later. It is restaurant format and franchise status together. The two dimensions answer different questions. Format tells you where the concept sits in the restaurant market. Franchise status tells you whether the borrower is operating under a franchised system, and in this data that flag changes the delinquency rate in both directions you care about: level and balance weight.
What a lender should take from it
The practical point is not that every franchise restaurant loan is worse than every independent restaurant loan. Loan-level underwriting still matters. Concept, location, sponsor history, leverage, rent burden, unit economics, and local competition can swamp any single flag.
The point is narrower and more useful: the franchise flag should not be treated as a stand-alone risk reducer in restaurant SBA lending.
If a lender is looking at a QSR franchise deal, the base rate in this active-book snapshot starts at 4.63% delinquent dollars. That is 1.30 percentage points above non-franchise QSR loans. It also comes with a larger average loan size and a larger share of the QSR balance pool.
If a lender is looking at a full-service franchise deal, the active-book base rate is even more uncomfortable: 5.27% delinquent dollars, versus 2.42% for non-franchise full-service loans. The volume is smaller, but the rate gap is wider.
That should change the first question in credit review. Instead of asking, "Is this a franchise, so do we get brand support?" the better question is, "What makes this specific franchise loan safer than the franchise restaurant base rate?"
That forces a better conversation. Does the borrower already operate units in the same concept? How mature is the location? Is the franchise system growing because unit economics are strong, or because development fees are strong? Is the borrower buying an existing cash-flowing unit or building a new store that needs to ramp from zero? How much of the projected margin disappears if labor or occupancy costs move against the borrower?
The SBA file will not answer those questions. It gives you the base rates that tell you which questions deserve pressure.
Why this is easy to overstate
There are two caveats I would keep close.
First, "non-franchise" means the SBA loan is not flagged as franchise in the source data. That bucket includes independent restaurants, local operators, and any loan where the franchise field is not populated. It is not a perfect label for "mom-and-pop independent." It is the available SBA flag.
Second, this is active-book delinquency, not lifetime chargeoff performance. A delinquent loan can cure. A current loan can default later. Chargeoff analysis answers a different question, especially when it is built from fixed approval cohorts. I used that approach in the earlier SBA acquisition-versus-startup chargeoff analysis, where each loan had a comparable observation window.
This chart answers a current exposure question: in the latest active SBA restaurant book, which dollars are currently delinquent?
That matters for lenders and portfolio teams because the active book is what they are managing now. A five-year chargeoff cohort is better for long-run underwriting history. A delinquency snapshot is better for seeing where pressure is showing up today.
Methodology
This analysis uses SBA FOIA bulk data via data.sba.gov, from the same loan-level files behind the SBA loan data product and the SBA 7(a) dataset.
The cut is limited to active SBA 7(a) loans in two restaurant NAICS categories:
722513, Limited-Service Restaurants722511, Full-Service Restaurants
The snapshot date is 2026-03-31. Active statuses are CURR, DEFERD, DELINQ, and PSTDUE. I calculate delinquency as:
(DELINQ dollars + PSTDUE dollars) / active dollars
The rate is dollar-weighted, not loan-count-weighted. That is why loan size matters. A $2M delinquent loan moves the rate more than a $200K delinquent loan.
Balance mix is calculated within each restaurant format. For example, QSR franchise loans are 58% of active QSR / limited-service dollars, while QSR non-franchise loans are 42%. Average loan size is active dollars divided by active loan count for each row.
The full loan-level file includes status, program, geography, industry, balance, franchise flag, and other fields used in this cut. Pricing is listed on the main LoanTape pricing page.
The cleanest takeaway is this: in the latest active SBA 7(a) restaurant book, franchise restaurants show higher dollar-weighted delinquency than non-franchise restaurants in both major restaurant formats. In QSR, the franchise side is also the larger balance pool. That is the base rate to check before relying on the brand.