The Exits Closed: Why Auto Delinquencies Last Longer
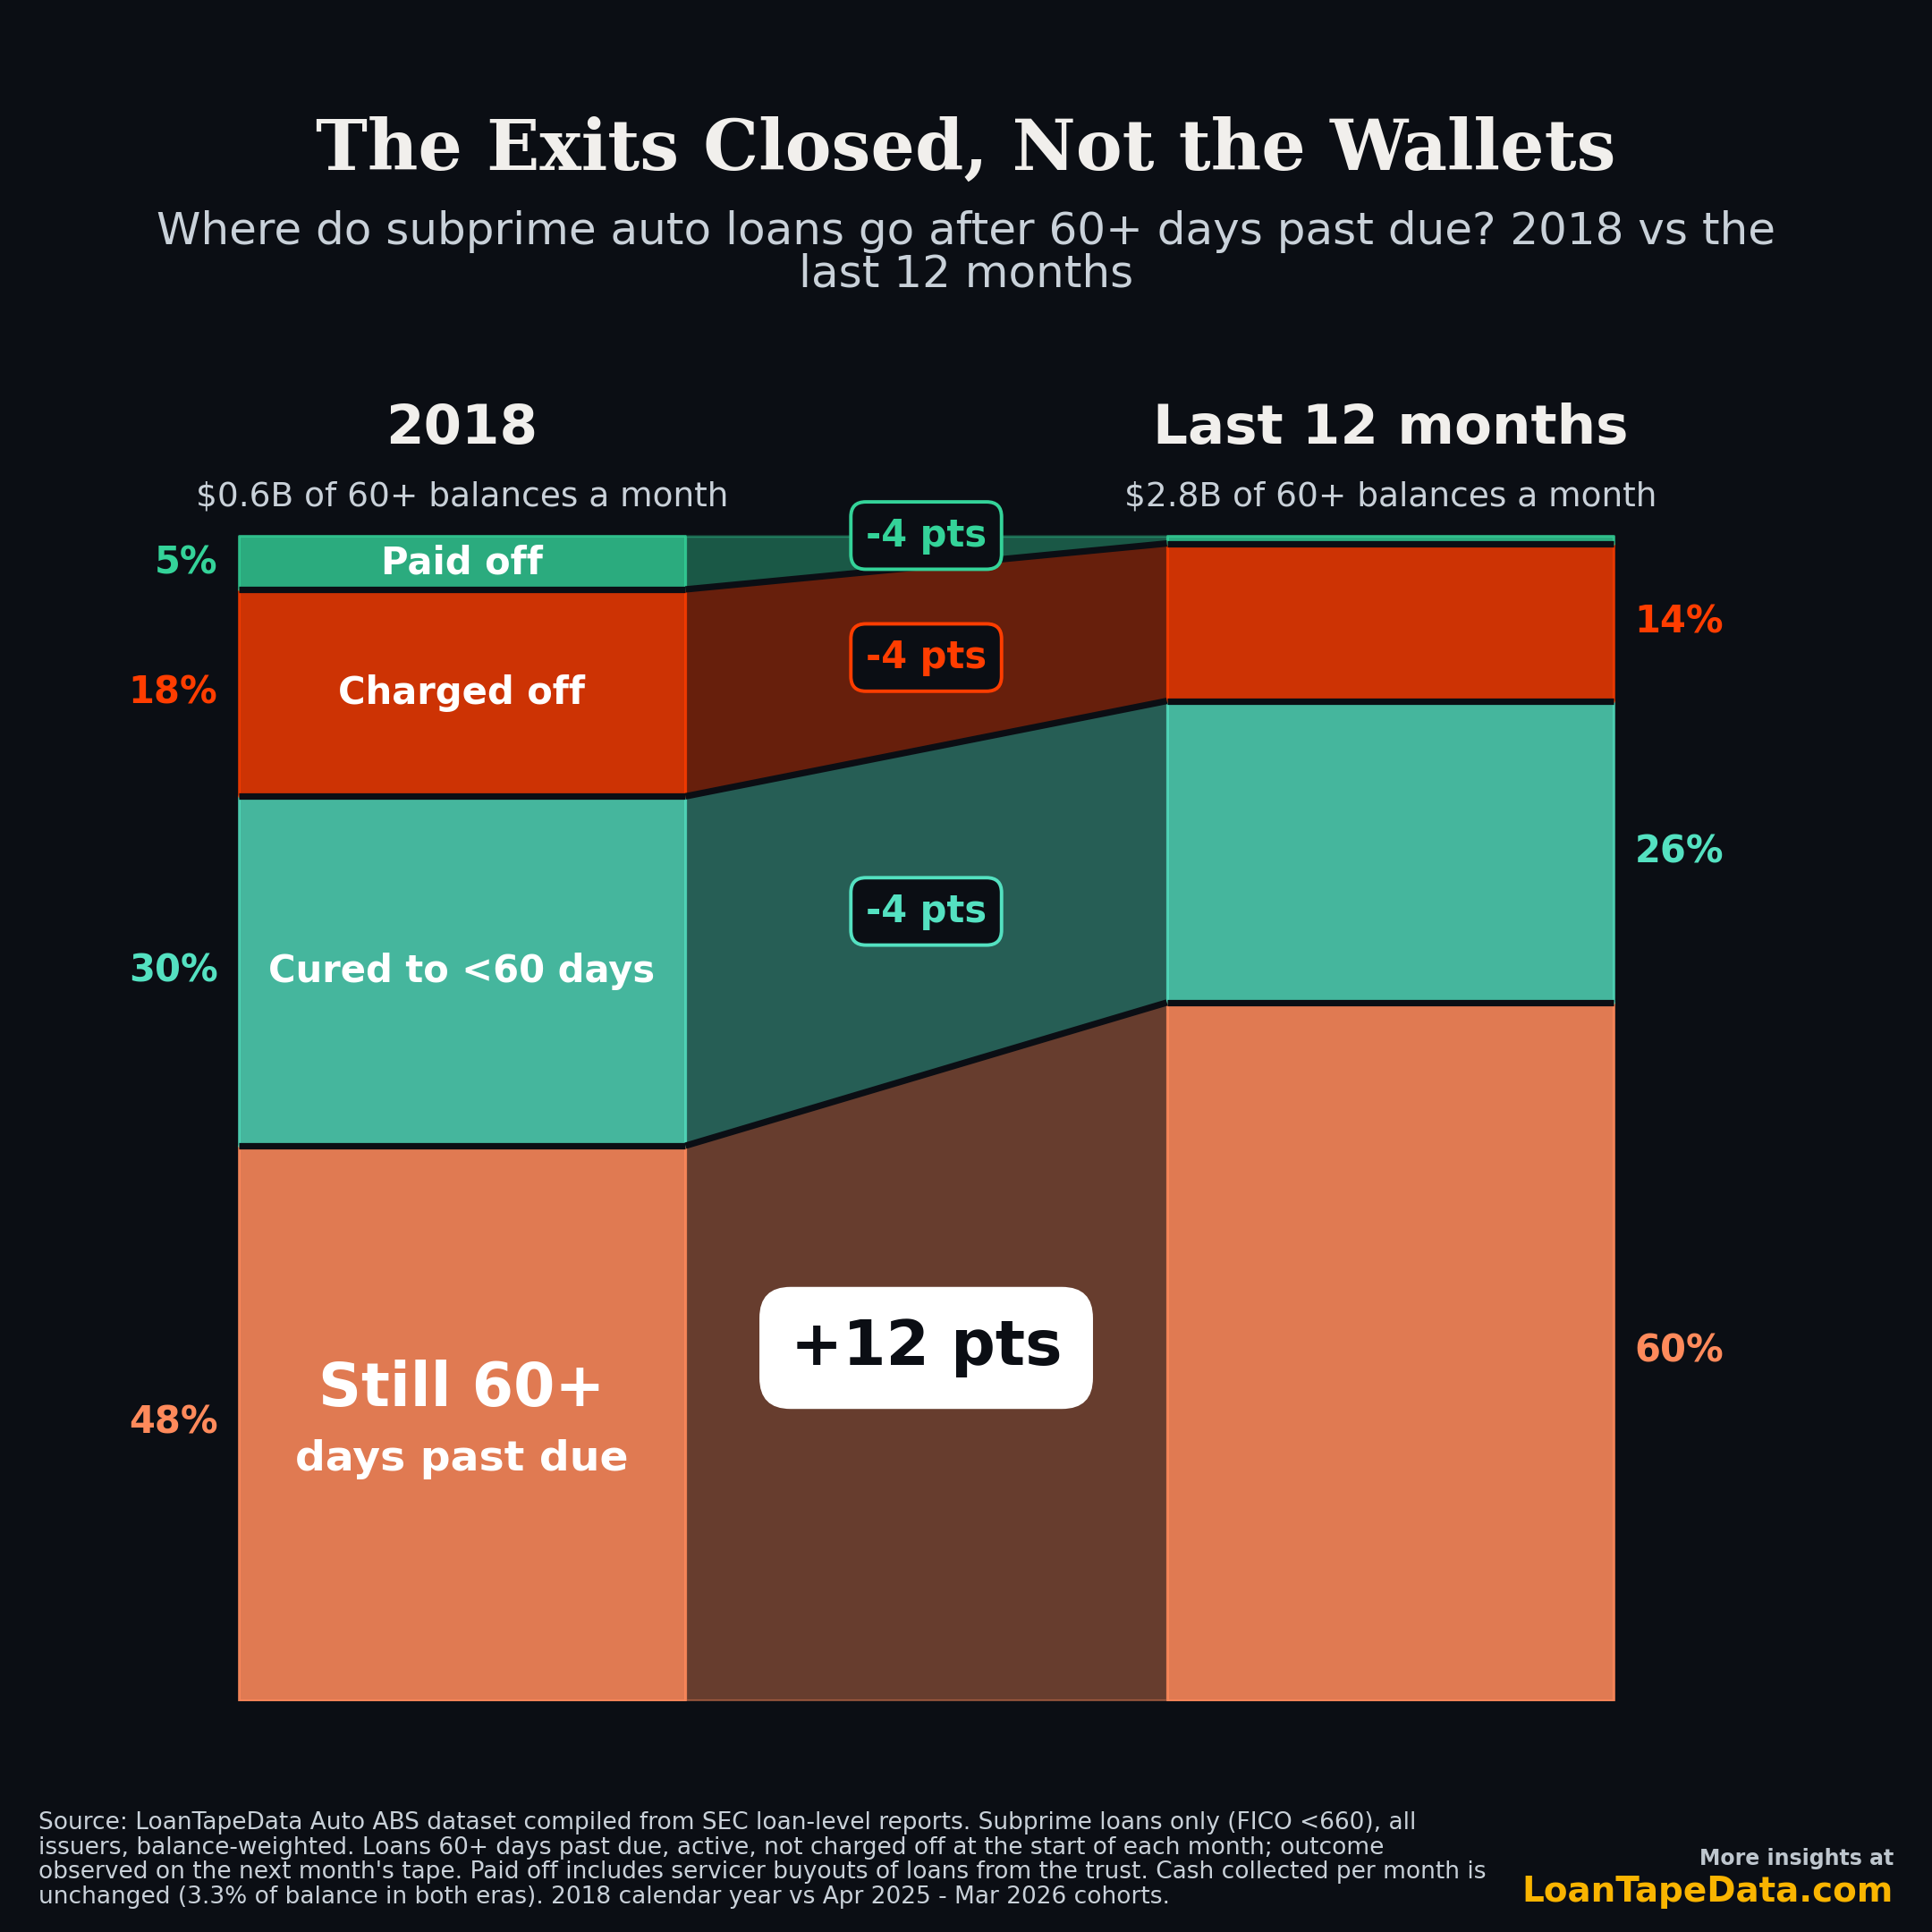
In 2018, a dollar of subprime auto loan balance that hit 60+ days past due had a 48% chance of still being 60+ days past due a month later. Over the last twelve months, that number is 60%.
The obvious read is that borrowers are in worse shape. The loan-level data says otherwise. Delinquent borrowers are handing over exactly as much cash as they did in 2018. What changed is what servicers do with a delinquent loan, and the answer, increasingly, is nothing.
Follow the dollar
We track every loan in the ABS-EE loan-level filings month over month, so we can watch what happens to each delinquent dollar. Take every subprime loan (origination FICO below 660) that is 60+ days past due, active, and not charged off at the start of a month, and check where it stands on the next month's tape:
| One month later | 2018 | Last 12 months |
|---|---|---|
| Still 60+ days past due | 47.6% | 59.9% |
| Cured to under 60 days | 30.0% | 25.9% |
| Charged off | 17.8% | 13.5% |
| Paid off or bought out of the trust | 4.6% | 0.6% |
Every exit narrowed. Fewer cures, slower charge-offs, and the payoff-or-buyout door is essentially shut. The residual is the stuck share, up 12 points.
Here is the part that changes the interpretation. Cash collected from that 60+ cohort ran at 3.28% of balance per month in 2018 and 3.33% over the last twelve months. Borrowers who stay delinquent paid 79% of their scheduled payment in 2018 and 78% now. Identical behavior, on a cohort that is now five times larger: the subprime 60+ stock averaged $0.6B a month in 2018 and $2.8B over the last year.
So the delinquent book pays like it always did. It just doesn't go anywhere afterward.
One more number for the cash flow readers: of every dollar collected from loans that stay 60+ delinquent, about 68 cents goes to interest and fees and 32 cents to principal. Balances on stuck loans amortize at roughly 0.7% a month. A stable, paying, barely-amortizing delinquent stock is a servicing revenue stream more than it is a resolution process.
The three exits, one at a time
Repossession. The share of 60+ balances newly repossessed within a month fell from 13% in 2018 to 7% over the last twelve months. This is the biggest single behavior change in the data. It also isn't a straight line: the repo rate bottomed near 5% during 2024 and has been climbing again since early 2025. Servicers repossess half as fast as they did in 2018, but the direction has recently turned.
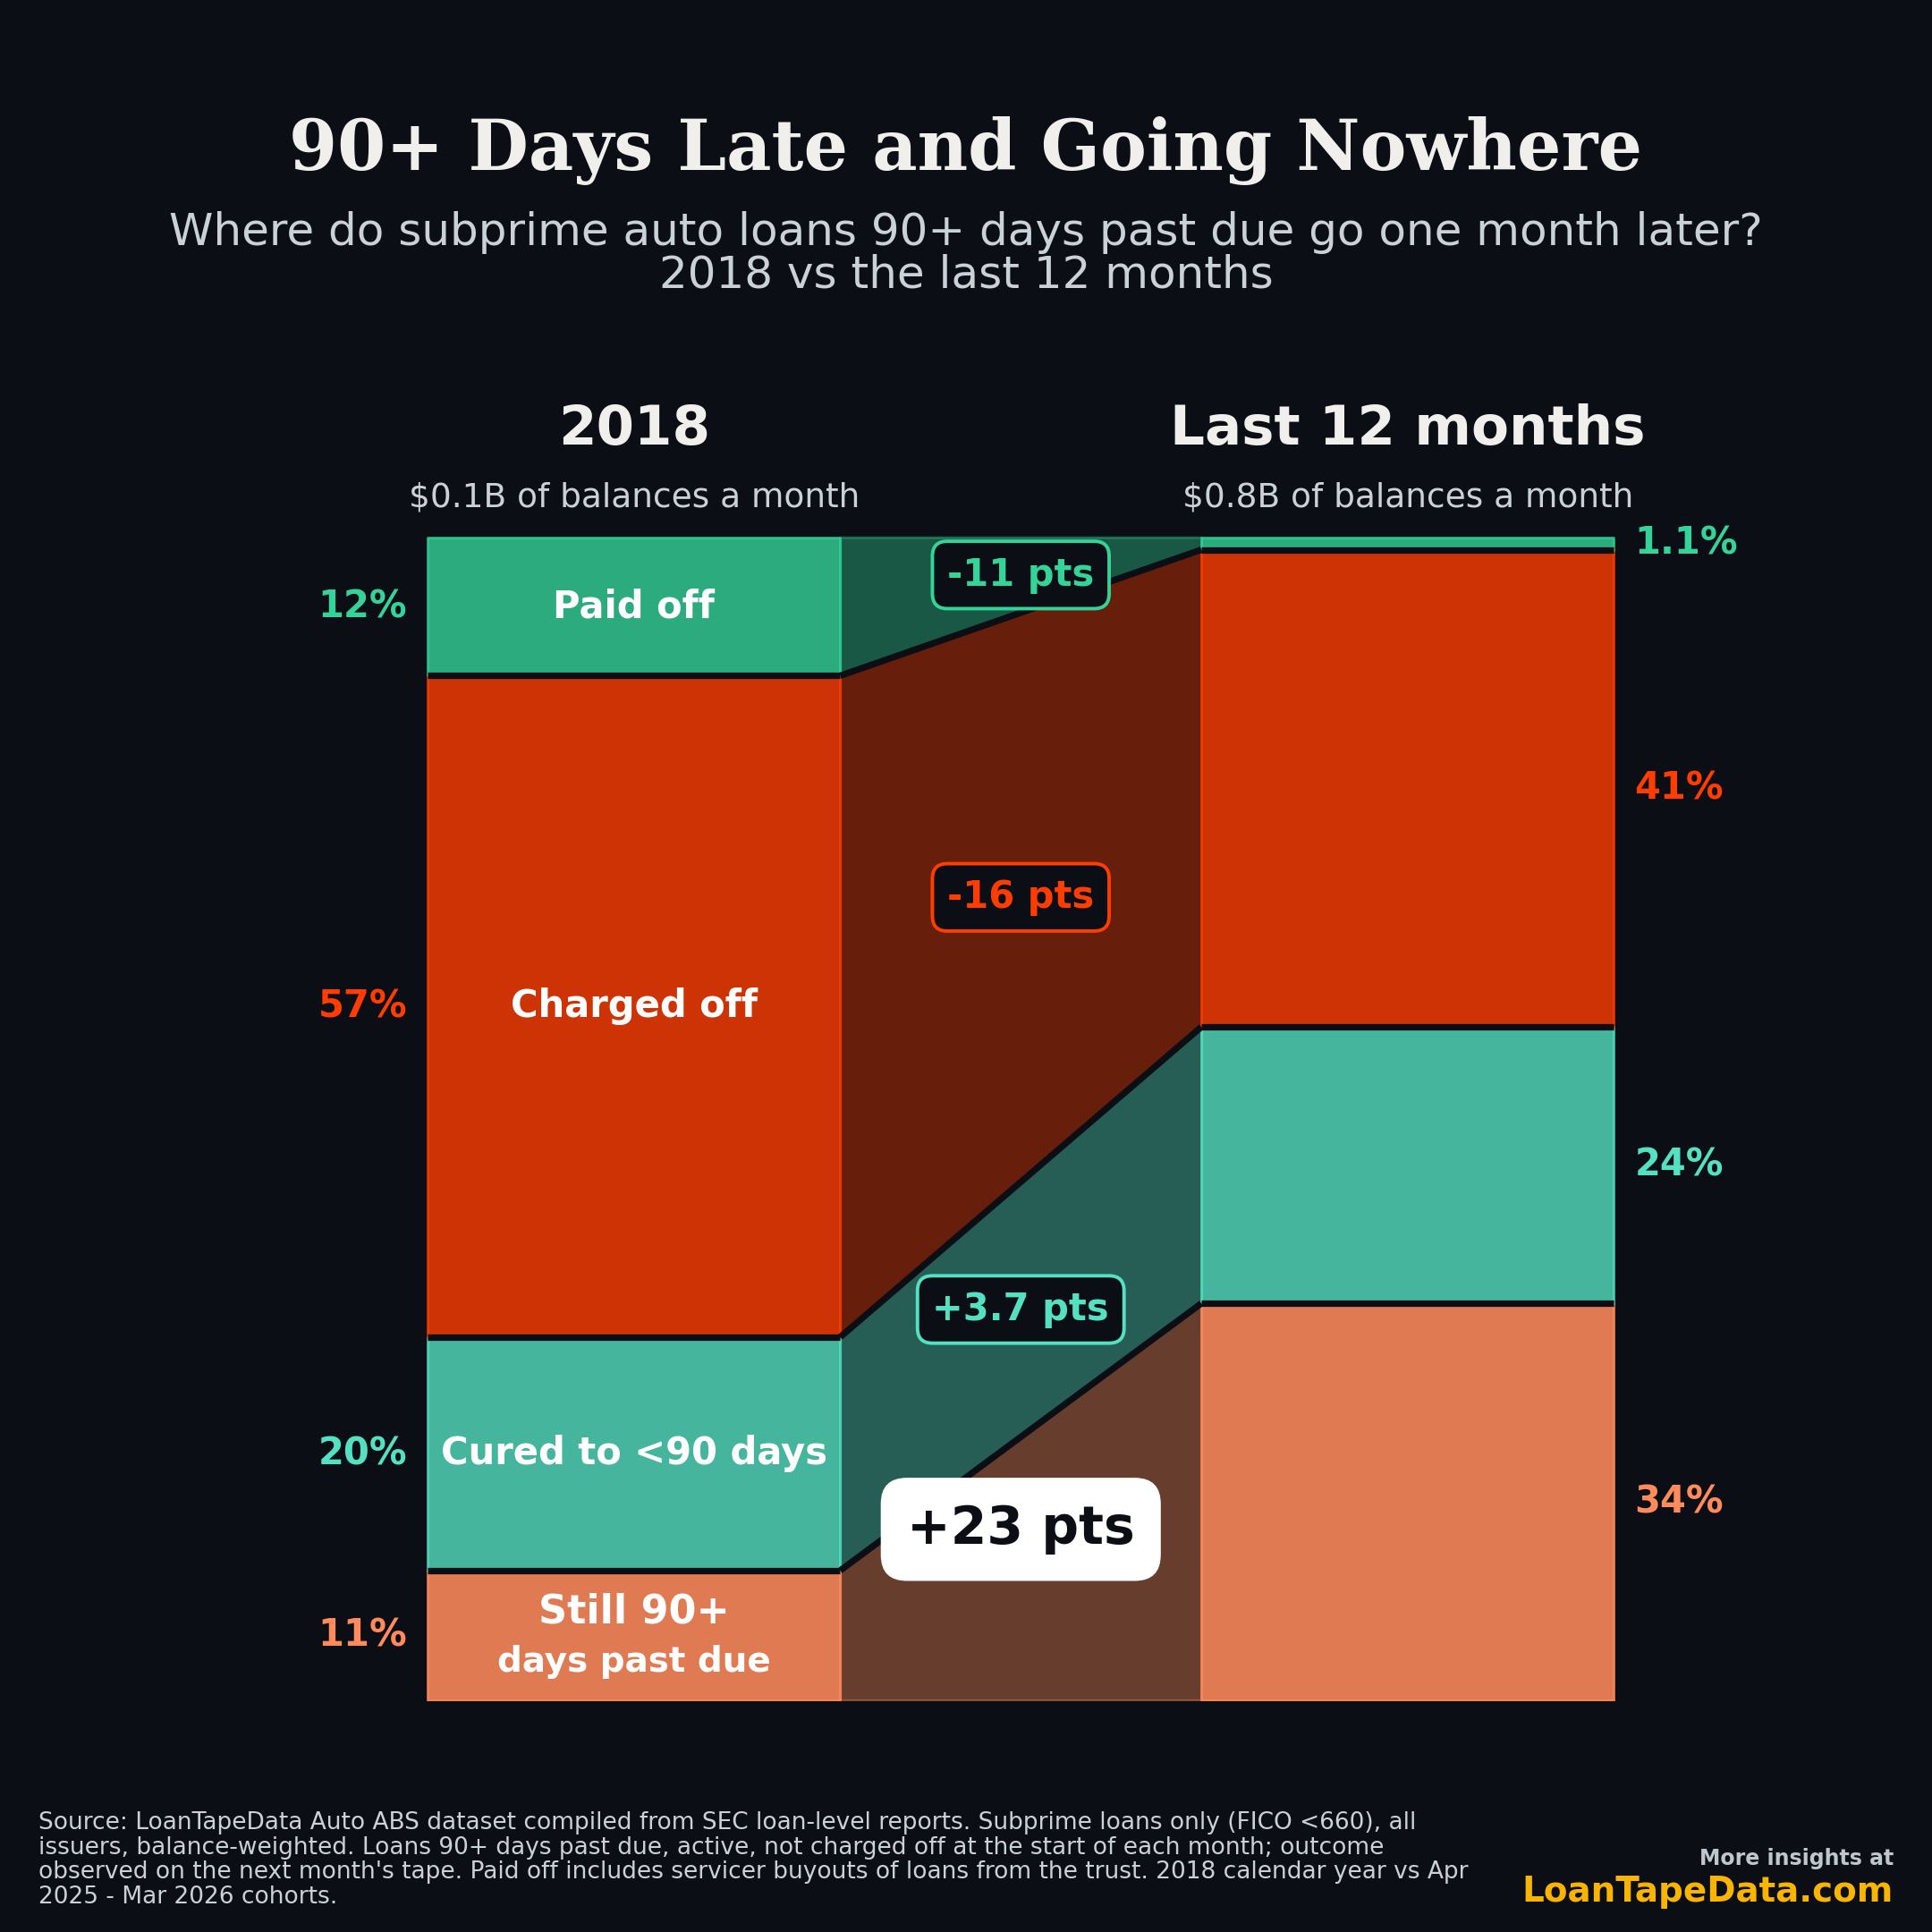
Charge-off recognition. Monthly charge-offs from the 60+ cohort fell from 18% to 14%, and from the 90+ cohort from 57% to 41%. In 2018 a loan that reached 90 days was, more often than not, charged off within a month. Today it usually just stays on the tape.
Trust buyouts. This one surprised us. In 2018, 4.2% of subprime 60+ balances left the tape each month because the servicer repurchased the loan out of the securitization trust, almost entirely a Drive and Santander practice. Drive bought out 6.5% of its 60+ stock per month; Santander 4.7%. Deal documents typically require repurchase when a loan is modified beyond the trust's limits, so heavy extension activity forced loans out at par. Today those rates are 0.8% and 0.3%. Newer deal structures allow more modification in-trust, so the delinquent loan stays in the pool. If you follow our extension work, this is the same story from the other side: the borrower who would have been bought out and worked out privately in 2018 is now extended inside the trust, in front of ABS investors.
It happens at every rung of the ladder
The 60+ chart is one slice of a pattern that holds at every delinquency depth. Same calculation, five cohorts:
| Cohort at month start | Stuck share, 2018 | Stuck share, last 12m | Change |
|---|---|---|---|
| Current (still current) | 87% | 86% | -1.2 pts |
| 30-59 days (still 30+) | 63% | 71% | +7.9 pts |
| 30+ days (still 30+) | 62% | 71% | +9.4 pts |
| 60+ days (still 60+) | 48% | 60% | +12.3 pts |
| 90+ days (still 90+) | 11% | 34% | +23.0 pts |
The front door is fine. Current loans roll into delinquency at almost exactly the 2018 rate. The change is entirely about what happens after a loan is already late, and it compounds with depth.
The 90+ row deserves a second look. In 2018, deep delinquency was a waiting room: 57% charged off within a month, 12% paid off (mostly buyouts), and only 11% lingered. Now 34% linger. The cure rate from 90+ actually improved, from 20% to 24%, which cuts against any story about borrowers being more broken. Servicers just stopped pulling the plug, so the loans that would have been resolved sit instead.
This is not a subprime story
The natural objection: subprime borrowers bought cars at peak prices with high LTVs, they're underwater, of course they're stuck. If that were the driver, prime should look different. It doesn't.
| 30+ cohort, one month later | Prime (FICO 660+) | Subprime (<660) |
|---|---|---|
| Stuck share, 2018 | 55% | 62% |
| Stuck share, last 12m | 63% | 71% |
| Change | +7.9 pts | +9.4 pts |
| Cure rate change | -7.3 pts | -8.2 pts |
| Charge-off rate, both eras | ~5.4% | ~5.5% |
Prime delinquent loans got stickier by almost exactly the same amount as subprime, driven by the same cure compression, with charge-off recognition flat in both tiers. A credit-stress story would show subprime diverging from prime. A servicing-policy story shows them moving together, which is what the data shows. Post-COVID collections practices, state-level repo friction, CFPB attention, and the economics of holding a paying delinquent loan all point the same direction, and they apply to the whole industry, not one credit tier.
What to watch
The repo re-acceleration. The monthly repo rate on subprime 60+ balances has climbed from about 5% to 7% since early 2025. If servicers are starting to work through the backlog, the mechanical effect runs through this whole chain in reverse: more repossessions, faster charge-offs, and a shrinking stuck share, with recognized losses arriving on balances that today sit in the 60+ bucket. The monthly remittance data will show it within a couple of cycles if it continues.
Delinquency stocks as a loss reservoir. The subprime 60+ stock runs $2.8B a month across securitized pools we track, up from $0.6B in 2018. Some of that is market growth. The rest is the arithmetic of slower exits: when the outflow slows and the inflow doesn't, the pool rises. Headline delinquency rates are higher partly because delinquency itself lasts longer, and comparing today's DQ rate to 2018's without adjusting for duration overstates the difference in borrower behavior.
Loss timing, not just loss levels. For ABS investors the practical consequence is lag. A pool where 90+ loans charged off within a month recognized losses close to the credit event. A pool where a third of 90+ balances persist, paying mostly interest, recognizes those losses later, spread out, and after more excess spread has accrued to the deal. That's favorable for bondholders if the collateral eventually cures or liquidates near current recovery levels, and unfavorable if the deferred population performs worse than seasoned charge-off vintages did. The serial-extension data we've published suggests the second effect is real for the deepest cohorts.
Methodology
Everything above comes from loan-level ABS-EE filings across all issuers we track, balance-weighted, leases excluded. A cohort is every active, not-charged-off loan in the stated delinquency bucket at a month start; the outcome is read off the next month's tape. Charge-off means a zero-balance code of 4 or a charge-off date. Paid off means the loan left the tape or reported a zero balance without a charge-off marker, which includes servicer buyouts of loans from the trust. The 2018 window is the calendar year; the current window is April 2025 through March 2026 cohorts, the latest with complete follow-on filings from every issuer.
Two caveats. The 2018 90+ cohort is small ($0.1B a month) because charge-offs used to remove loans before they aged that far, so its percentages rest on a thinner base. And "repossessed within a month" is the repossession flag appearing by the next tape: some of the decline reflects servicers repossessing later rather than never, though the stable depth mix of the 60+ pool argues most of it is genuine volume.
If you want to run this against specific issuers or shelves, the underlying loan-month histories are in the ABS-EE dataset, and subscribers can pull the outcome decompositions directly.