High-LTV subprime extensions cure the least
Yesterday I showed that subprime borrowers with the least equity get a payment extension the most often. The 130%+ LTV group now extends at 3.0% of months versus 2.0% for the under-100% group, and that gap is new.
The obvious next question is whether those extensions work. When a servicer moves a payment, does the borrower recover, or do they just fall behind again two months later? It turns out the answer also tracks LTV, and in the same direction. The most underwater borrowers cure the least.
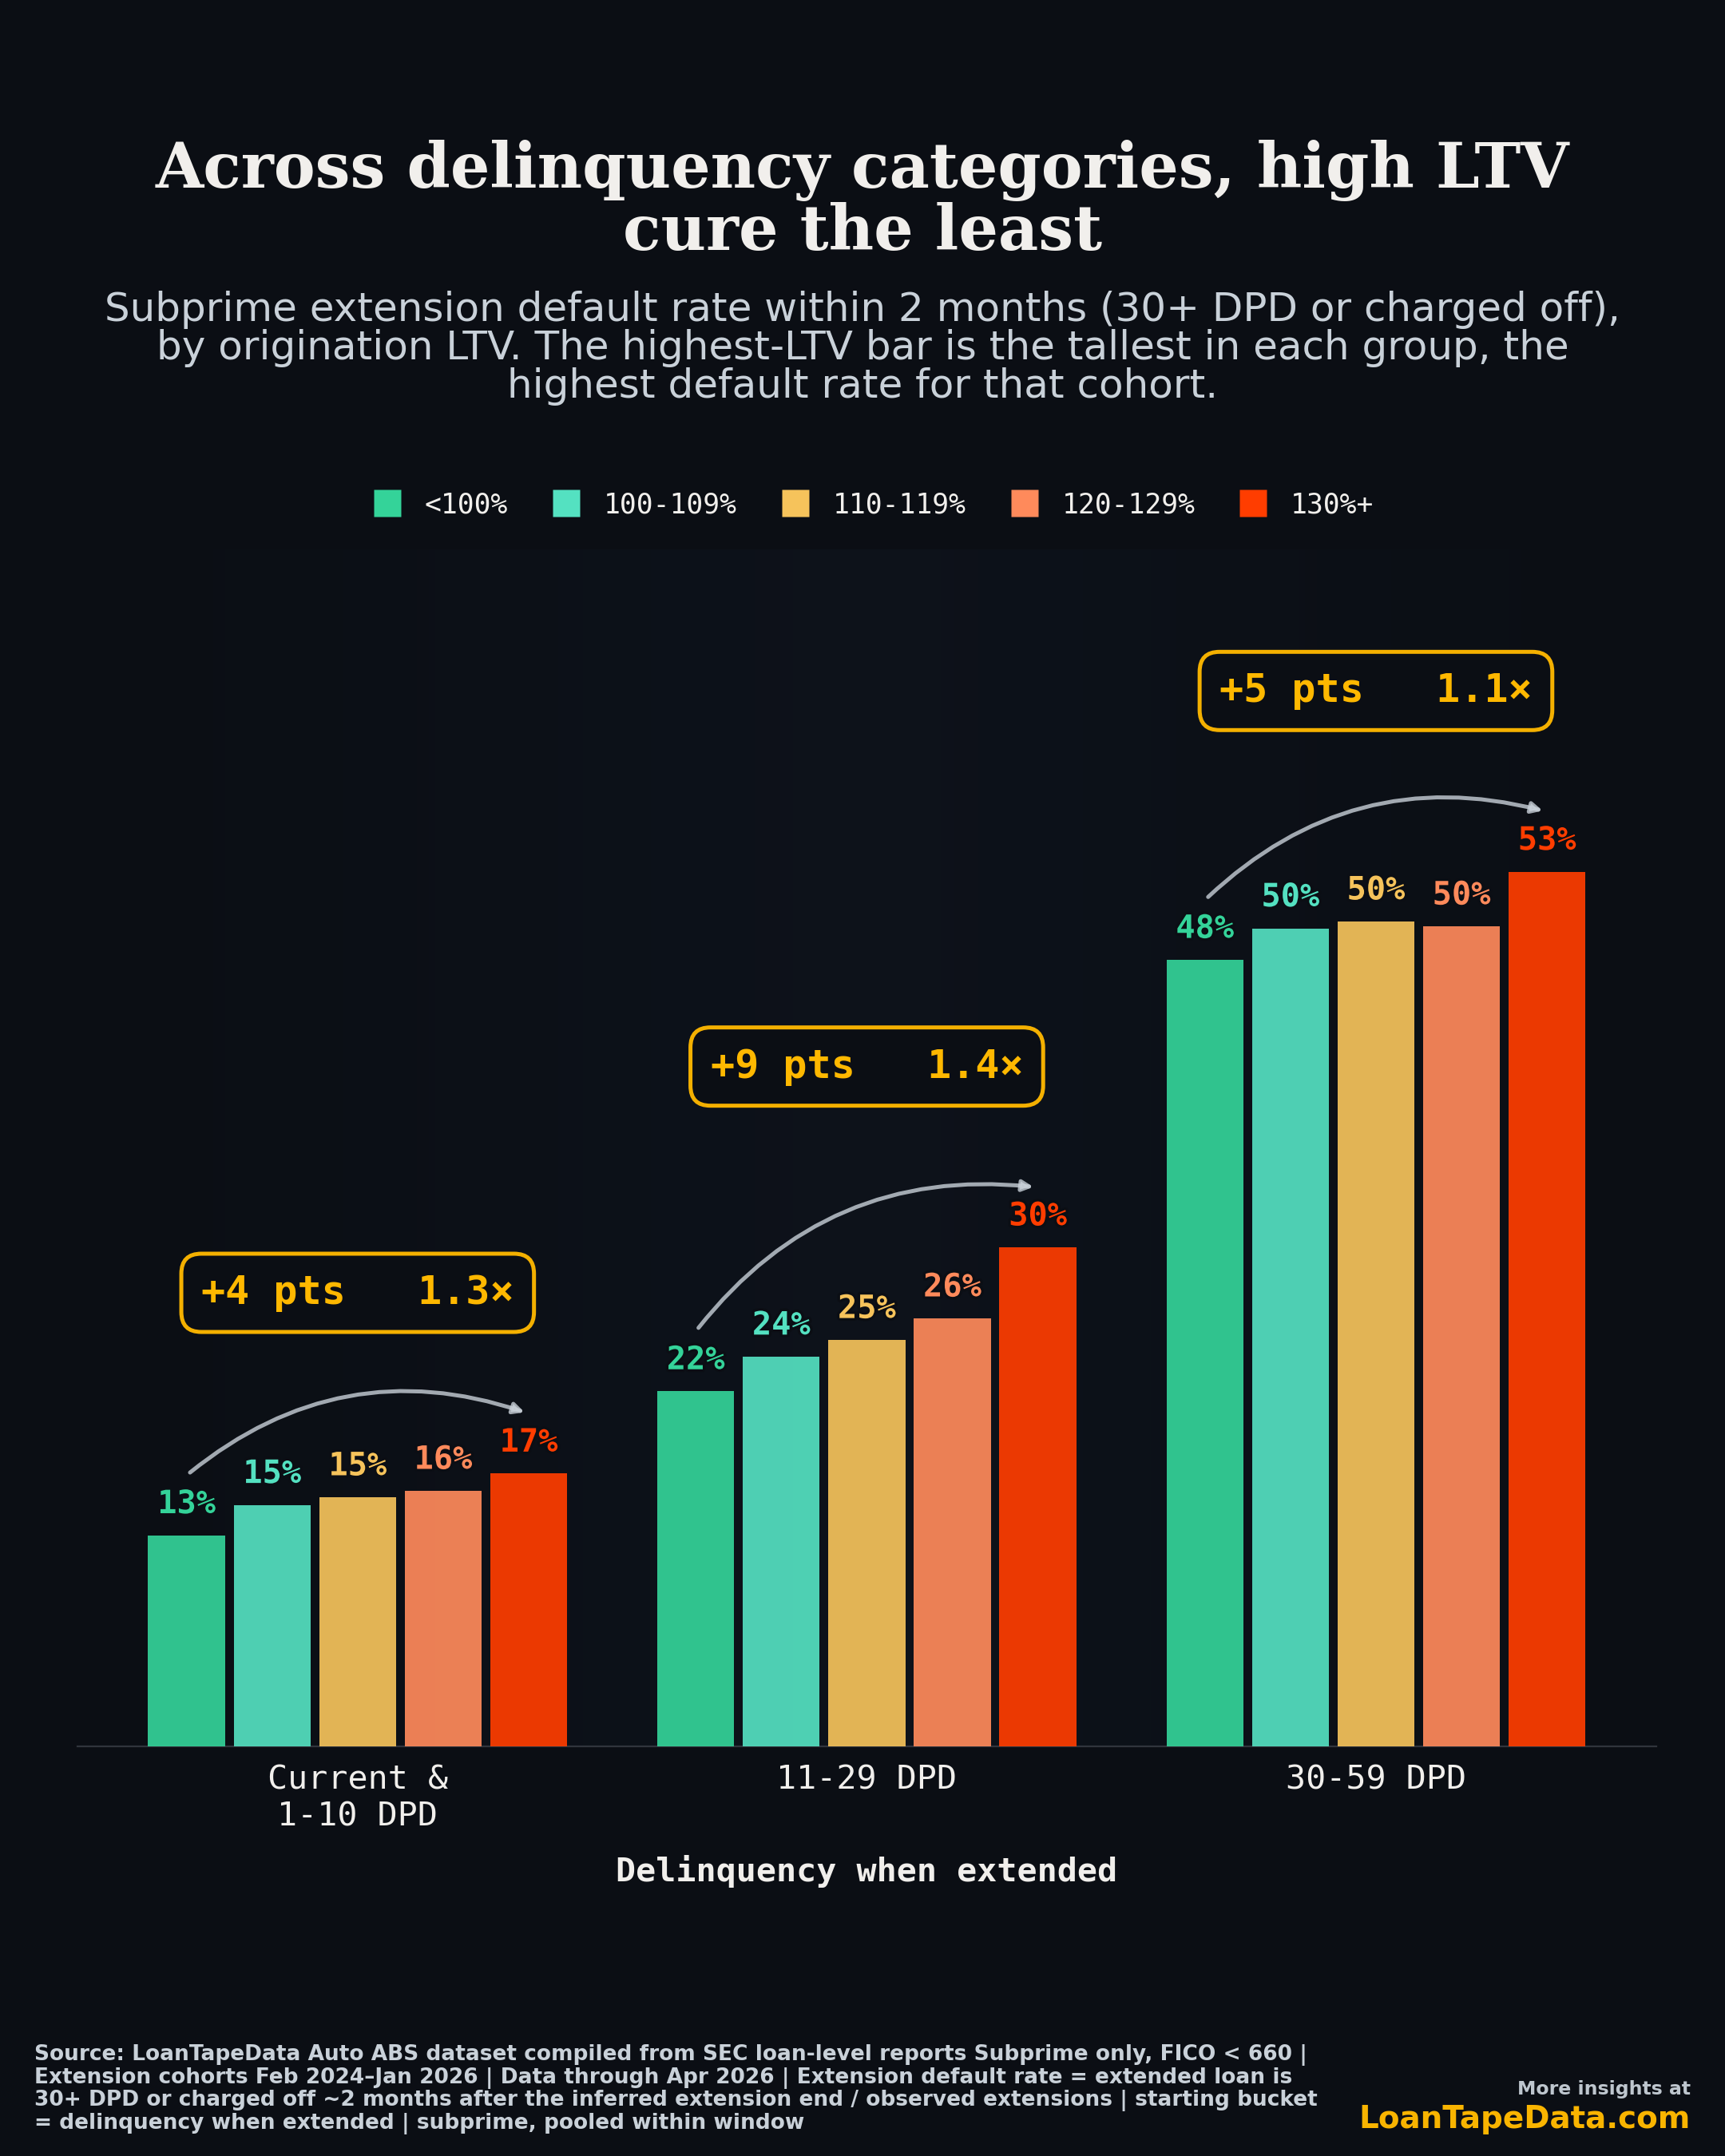
The same delinquency, worse odds when underwater
To make this a fair test, we hold the starting point constant. Take subprime loans that got an extension while in the same delinquency bucket, then measure how many are 30-plus DPD or charged off about two months after the deferred payments resume. We call that the extension default rate. Same starting delinquency, different LTV, so the only thing changing is how much equity the borrower has.
The penalty shows up in every bucket.
| Starting delinquency | <100% LTV | 130%+ LTV |
|---|---|---|
| Current / 1-10 DPD | 13% | 17% |
| 11-29 DPD | 22% | 30% |
| 30-59 DPD | 48% | 53% |
Look at the 11-29 DPD row. A borrower who was a few weeks late and got an extension defaults again at 30% if they are at 130%+ LTV, versus 22% if they are under 100%. That is about 1.4 times the rate, from the exact same starting point. The highest-LTV bar is the tallest in all three groups.
This is the part that should bother an ABS investor. An extension moves payment timing. It does not change the collateral. The loans where extensions stick the least are the same loans where a charge-off recovers the least, because there is no equity under them. So the relief is landing hardest where it does the least good.
It used to be the other way around
The cross-section is striking on its own. The time series is the part I did not expect.
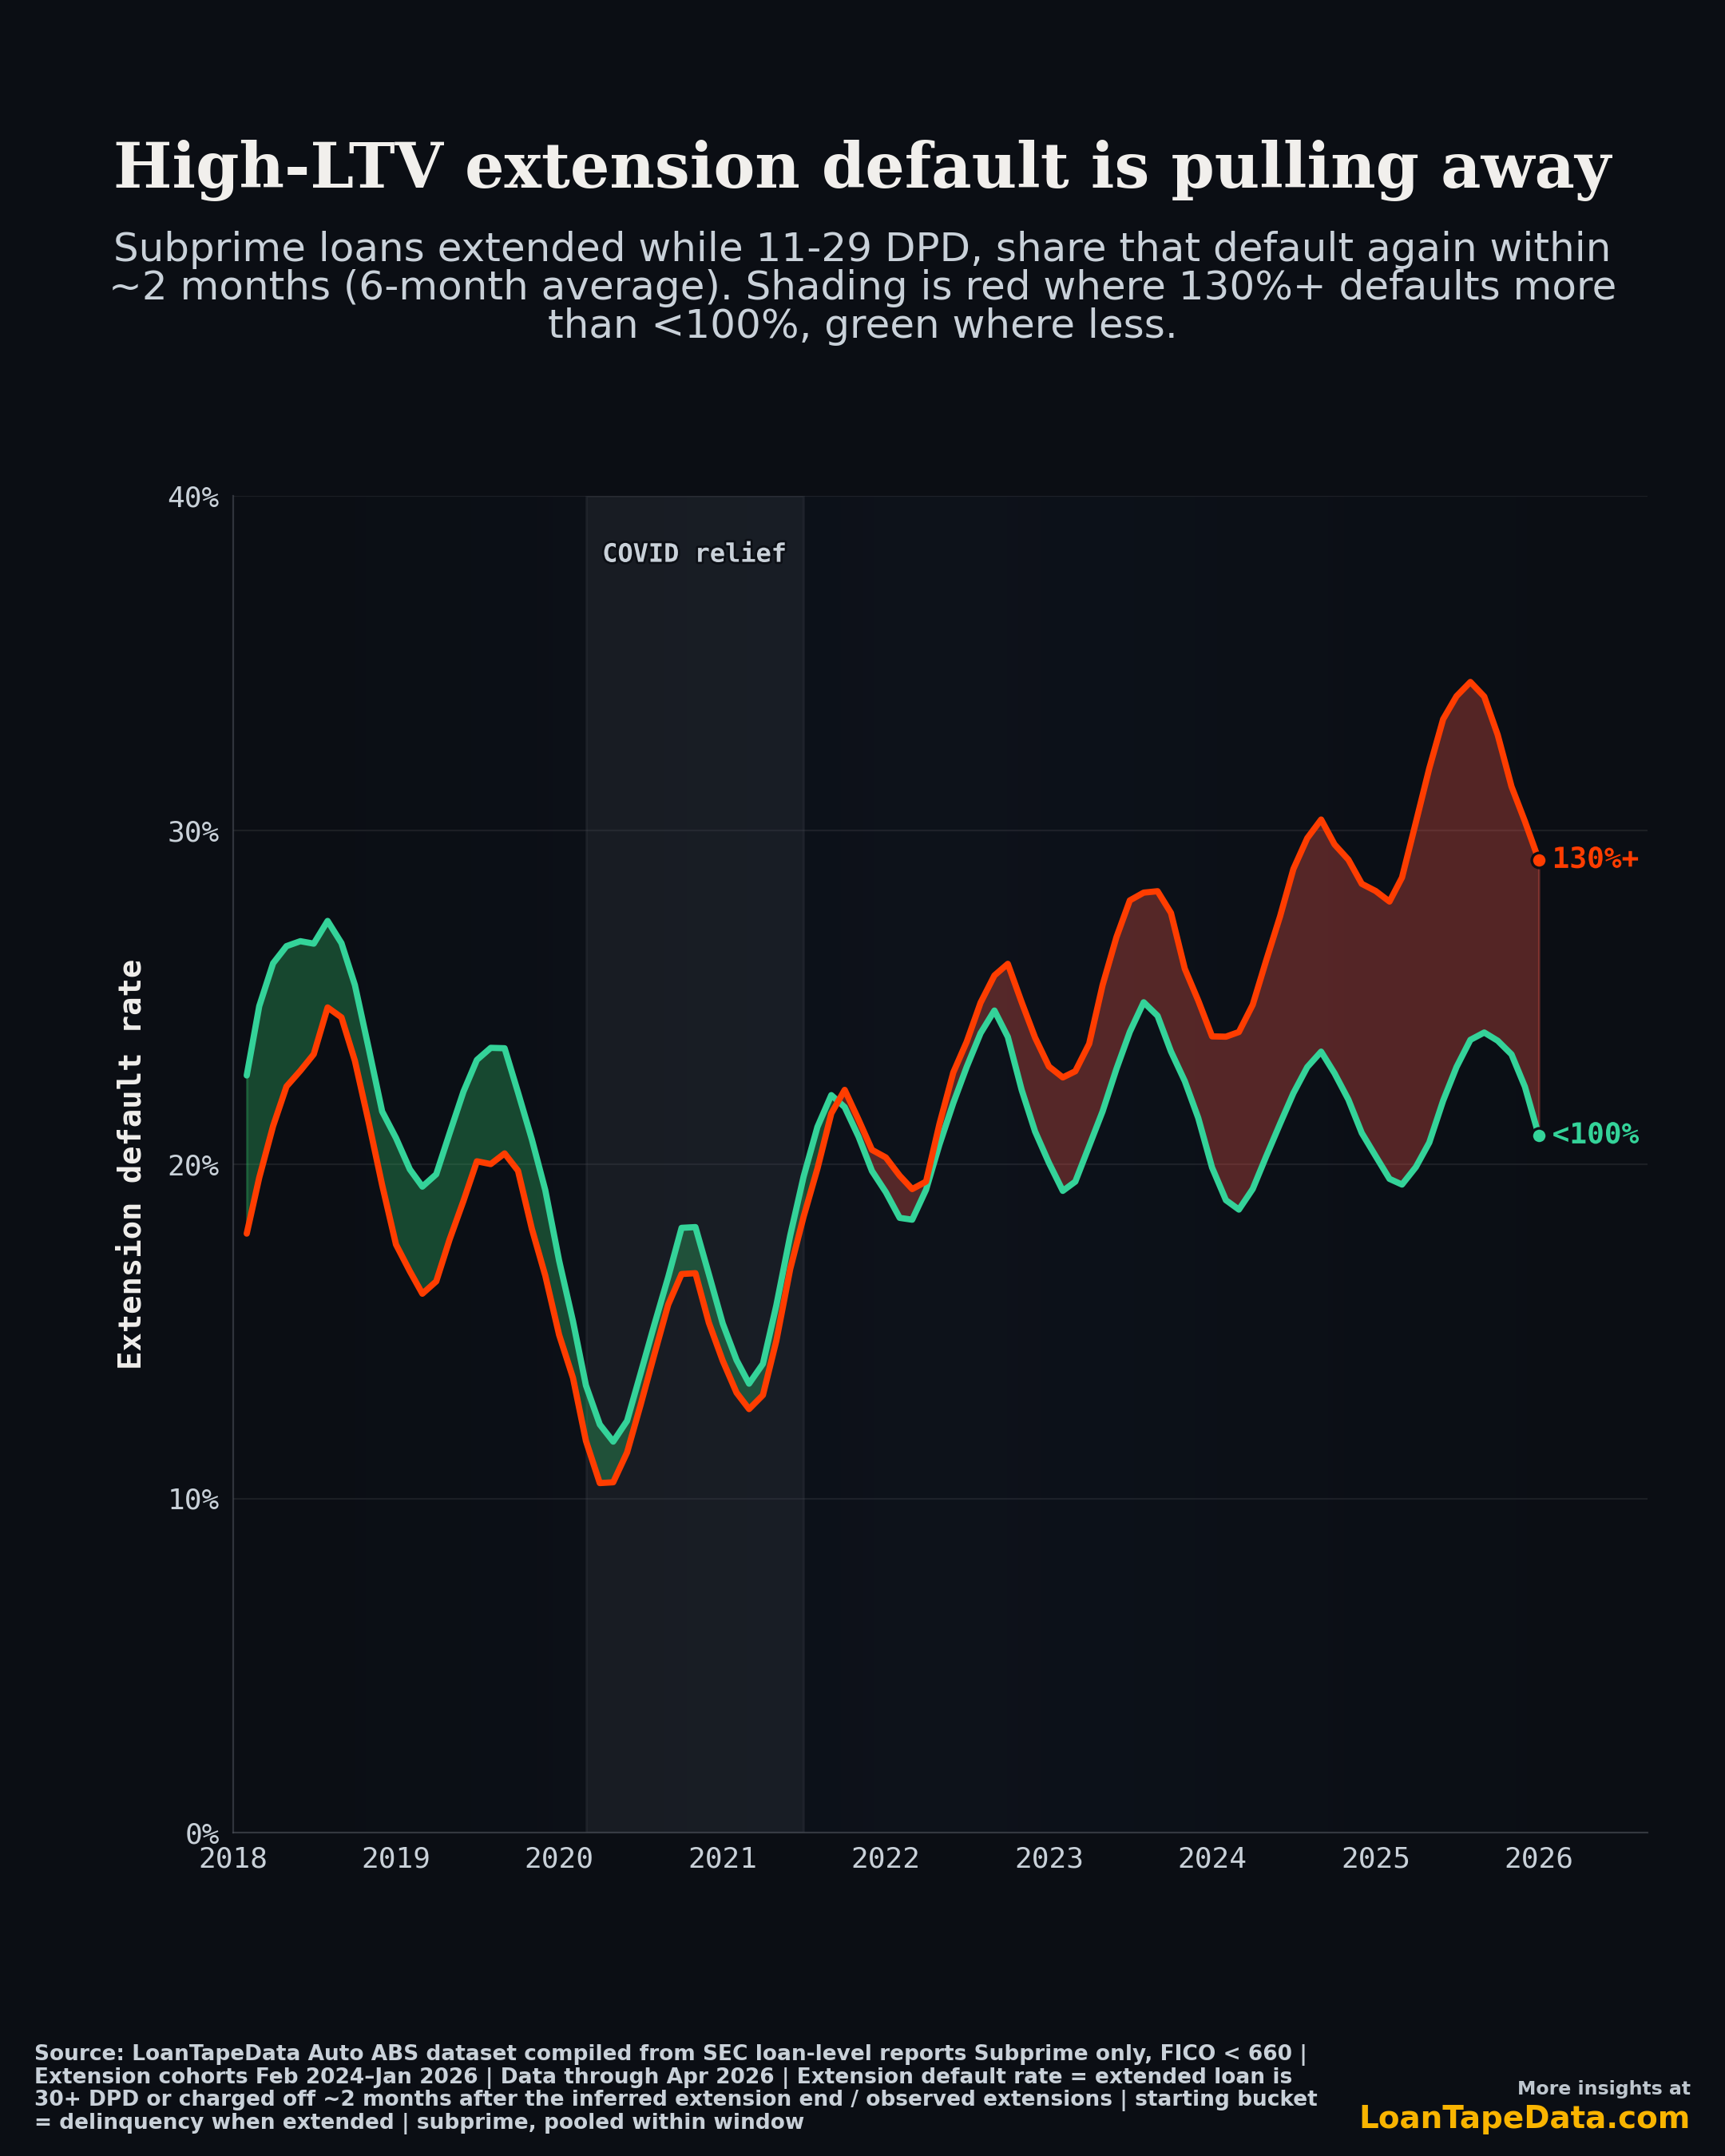
Through 2018 and 2019, and all through the COVID relief window, the 130%+ extension default rate sat at or below the under-100% rate. Underwater borrowers who got an extension cured about as well as anyone else, sometimes a touch better. The green stretch in the chart is that period.
That flipped around 2022. The 130%+ line crossed above the under-100% line and kept climbing. The penalty for being underwater when you get an extension has widened to roughly 10 points in the 11-29 DPD cohort, and it holds across the other starting buckets too. So this is not a fixed feature of high-LTV lending. It is a recent break, and it is still widening.
A few things changed at once that fit this. The 2021-and-later vintages came in with thinner equity and higher payments, used-car values came down from the 2021-2022 peak, and the borrowers stretched in those years are now the ones cycling through extensions. The extension data is where that shows up first, before it reaches the delinquency tape.
Whose extensions cure, and whose don't
The same loan-level data lets us ask which shelves this is concentrated in. Holding the comparison to current-loan extensions, so we are not just measuring who lends to riskier borrowers, the spread is wide.
The deep-subprime shelves cure worst. Exeter and Bridgecrest both run near 20% on current-loan extensions, while CarMax and Santander sit closer to 12 to 13%. That is a real servicing and collateral difference, not a mix artifact, because every issuer here is being measured on the same kind of cohort.
One caution that came out of the issuer work: raw issuer numbers mislead. Carvana's pooled extension default rate looks like it fell from 50% to 37% over the last two years, which reads like improving servicing. Hold the starting delinquency constant and it is flat near 15%. The drop was a shift in which borrowers Carvana extended, not better cures. If you compare issuers on extensions, control for who they are extending or the number tells you the opposite of the truth.
What this means for reading a pool
Put the two findings together. High-LTV subprime borrowers get extended more, and their extensions cure less. Both effects point the same way. On a pool that is heavy in thin-equity 2021-and-later collateral, extensions are doing more deferring than curing, and the delinquency chart will look calmer than the underlying credit until the deferral runs out.
That is the distinction the ABS market prices. An extension that cures is good servicing. An extension that defers is a loss moved one or two quarters into the future. The loan-level data says which one you are looking at, by LTV, by starting delinquency, and by issuer, before it shows up in losses.
What I would watch next
First, the 130%+ extension default rate in the early-delinquency buckets. If it holds above 30% in the 11-29 cohort, the deferral read gets stronger.
Second, issuer dispersion with mix controlled. The gap between the deep-subprime shelves and the captives is the cleaner signal than any single issuer's headline rate.
Third, the LTV gap over time. It widened from roughly zero to ten points since 2022. If it keeps widening, extensions are increasingly a high-LTV phenomenon that masks rather than resolves stress.
Methodology
The extension default rate is the share of observed treated extensions that are 30-plus DPD or charged off about two months after the inferred extension ends, over observed extensions. The horizon offsets by the number of payments moved before adding two months, so the outcome is measured after the deferred payments resume, not while the loan is still inside the deferral and looks current. Starting delinquency is the borrower's bucket the month before the extension. Subprime is FICO under 660. LTV is origination loan-to-value.
Cohorts are pooled over the latest 24 reporting months, with data through April 2026. The COVID relief window is shown but not used as a baseline. Issuer comparisons hold the starting delinquency bucket constant and use volume-weighted rates so a new, thin shelf does not swing the line.
This runs on the same loan-level infrastructure behind LoanTape's ABS-EE dataset, Form 10-D data, and ABS remittance data. It is the cure side of yesterday's piece on how high-LTV borrowers get extended the most, and it extends the case that auto extensions are a credit signal worth reading on their own. The subscriber version, with issuer, trust, and post-extension outcome cuts, is in the Modification Effectiveness Deep Dive. For the loan-level files behind it, see LoanTape pricing.