Aging Cars, Rising Delinquency in Subprime Auto
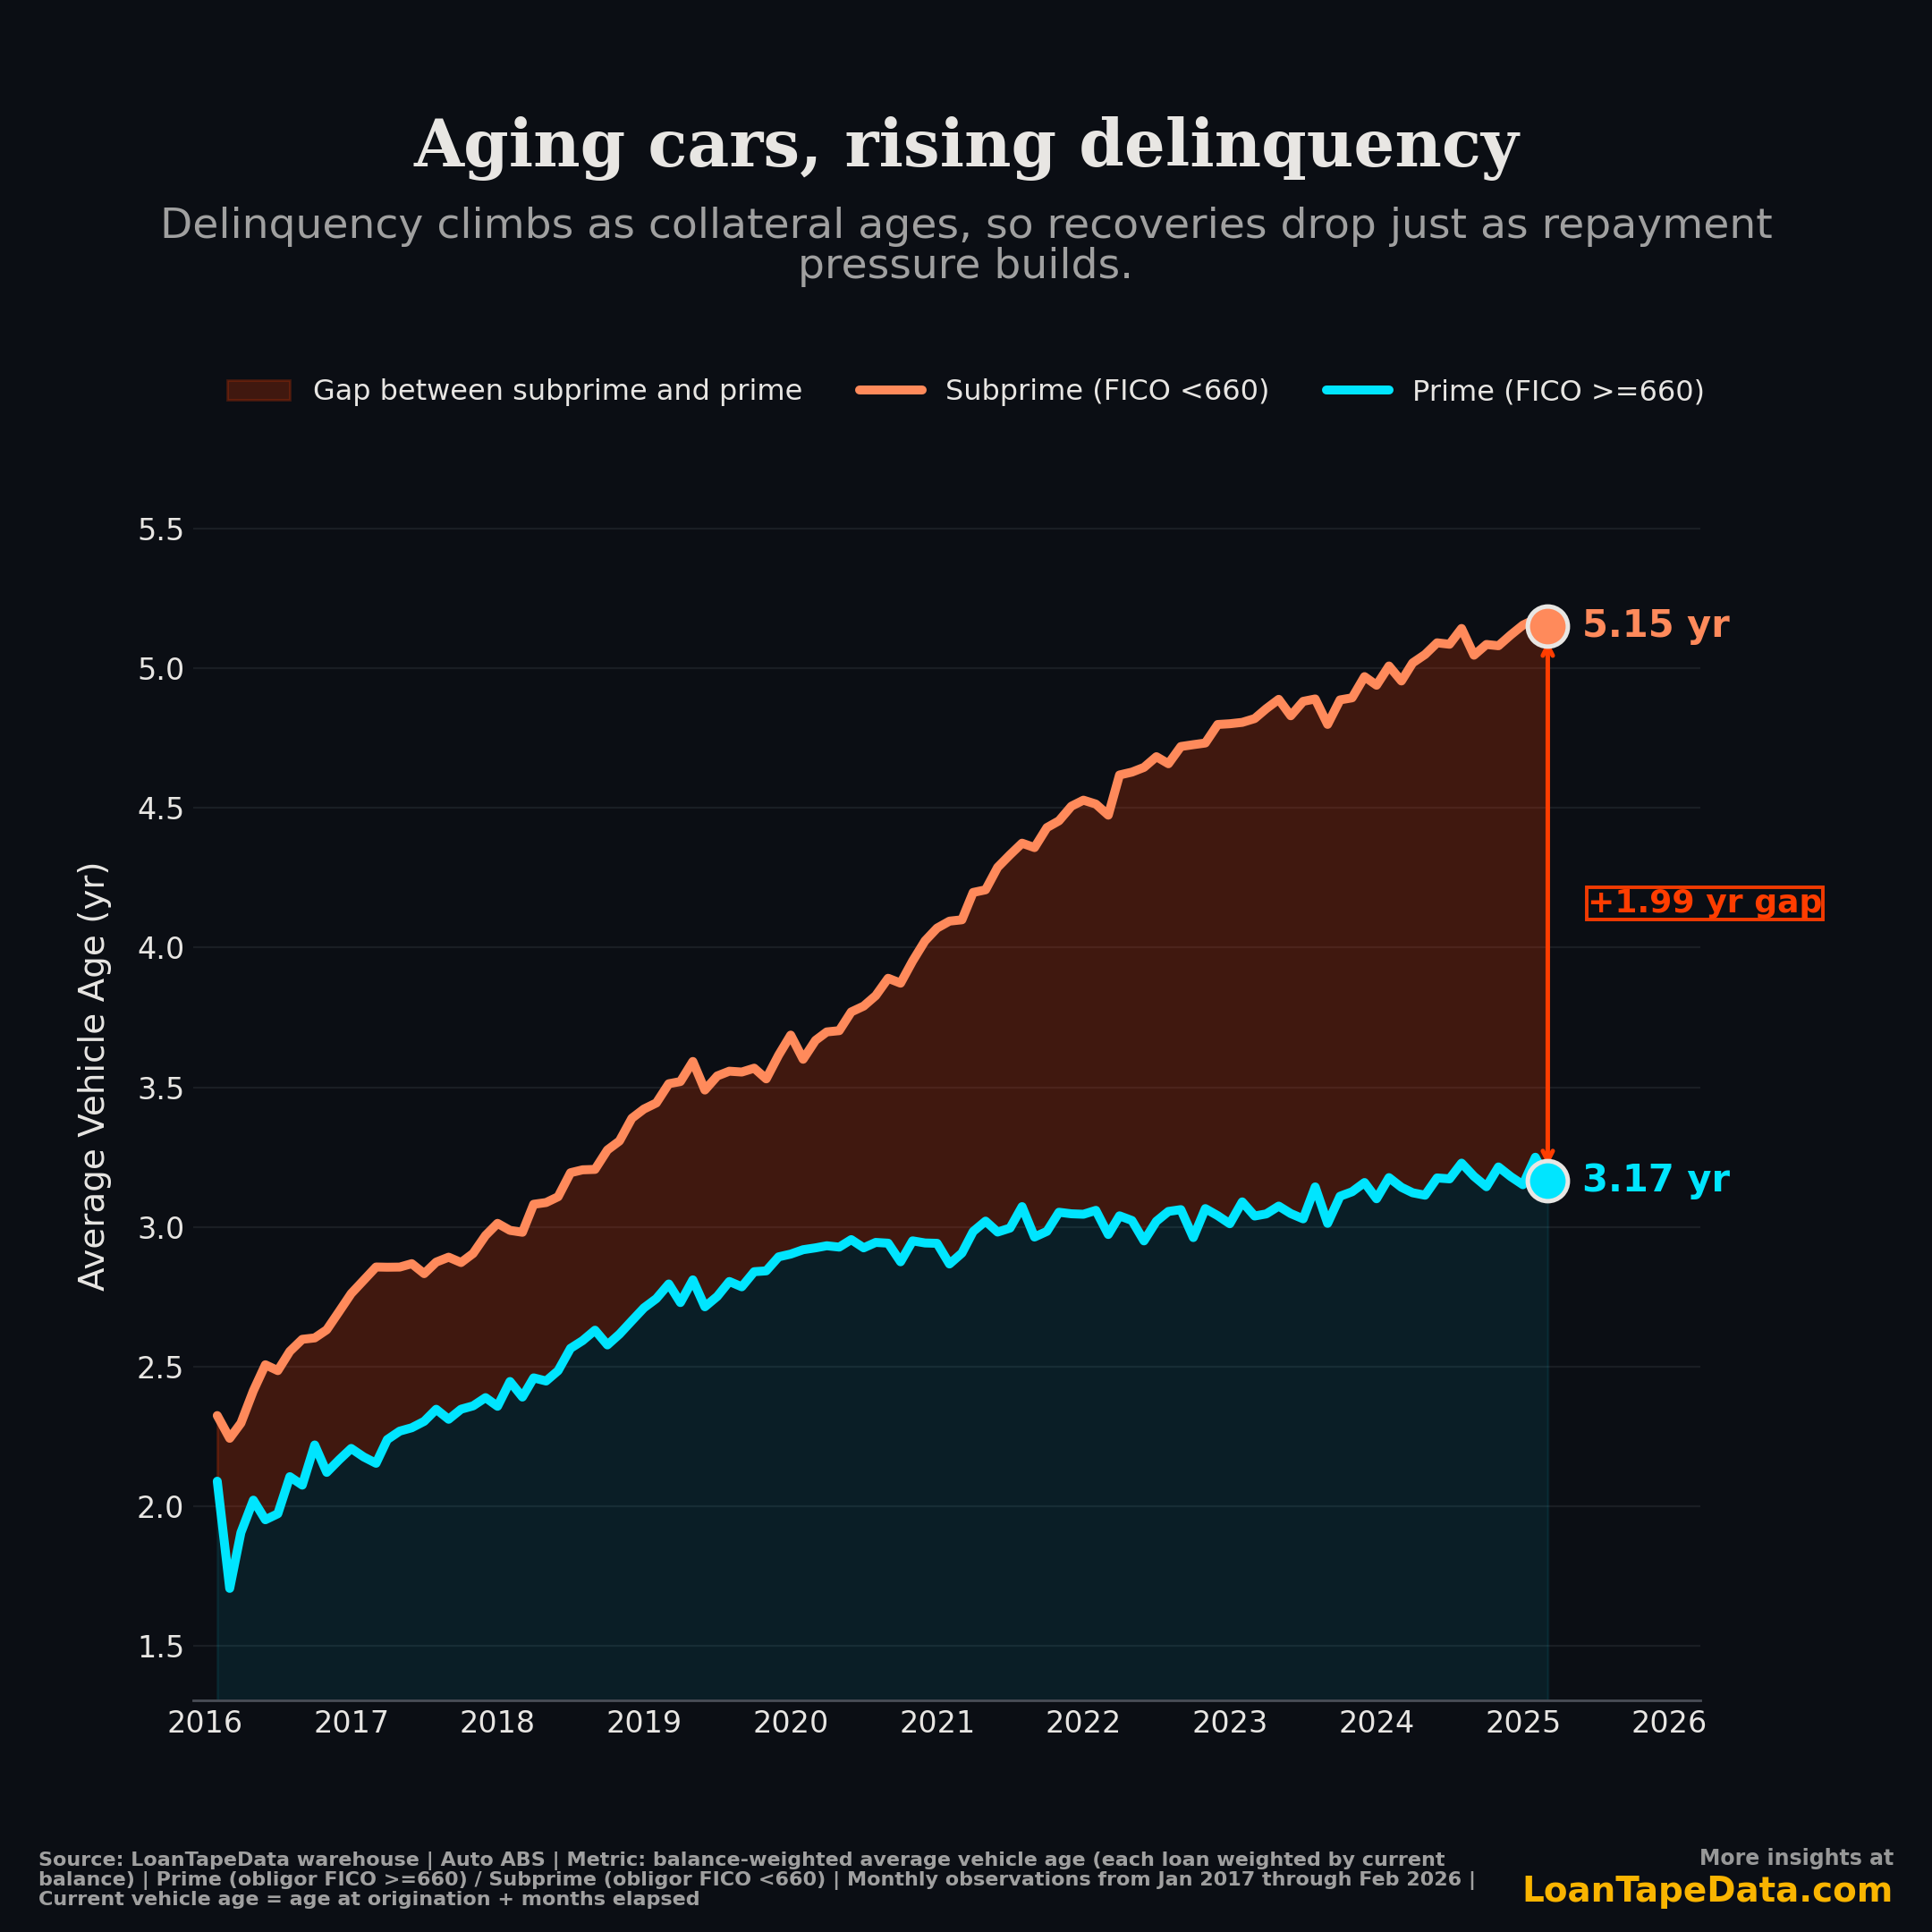
In January 2017, prime and subprime auto ABS pools held cars within a quarter-year of each other — prime at 2.1 years, subprime at 2.3.
Nine years on, they've split. Prime sits at 3.17 years. Subprime is at 5.15. The gap is just under 2 years.
Older cars sell for less at auction, and borrowers fall behind on them more often. So when a loan goes bad today, the loss per repo is bigger than it was five years ago on what looks like the same loan.
This isn't an aging-book story either. New subprime originations are landing on much older cars. About half of subprime entrants today are on vehicles 5+ years old at origination. Pre-2019, that share was 15%.
The combo bucket that pulls severity higher
The cleanest way to see this is one combined risk bucket: loans that hit both 120%+ origination LTV and 5+ years of vehicle age.
Why those two? Median loss severity climbs with LTV, and it climbs again with vehicle age. Loans at the top of both ladders take the biggest losses when they go.
Pre-COVID, the combo was a small slice. In 2018-2019 originations:
- Prime: 2.1% of originations hit both
- Subprime: 6.5% hit both
By 2025, prime had roughly doubled to 4.7%. Subprime had more than tripled to 21.8%. So better than one in five new subprime loans now lands in the worst-case bucket on both collateral axes at once.
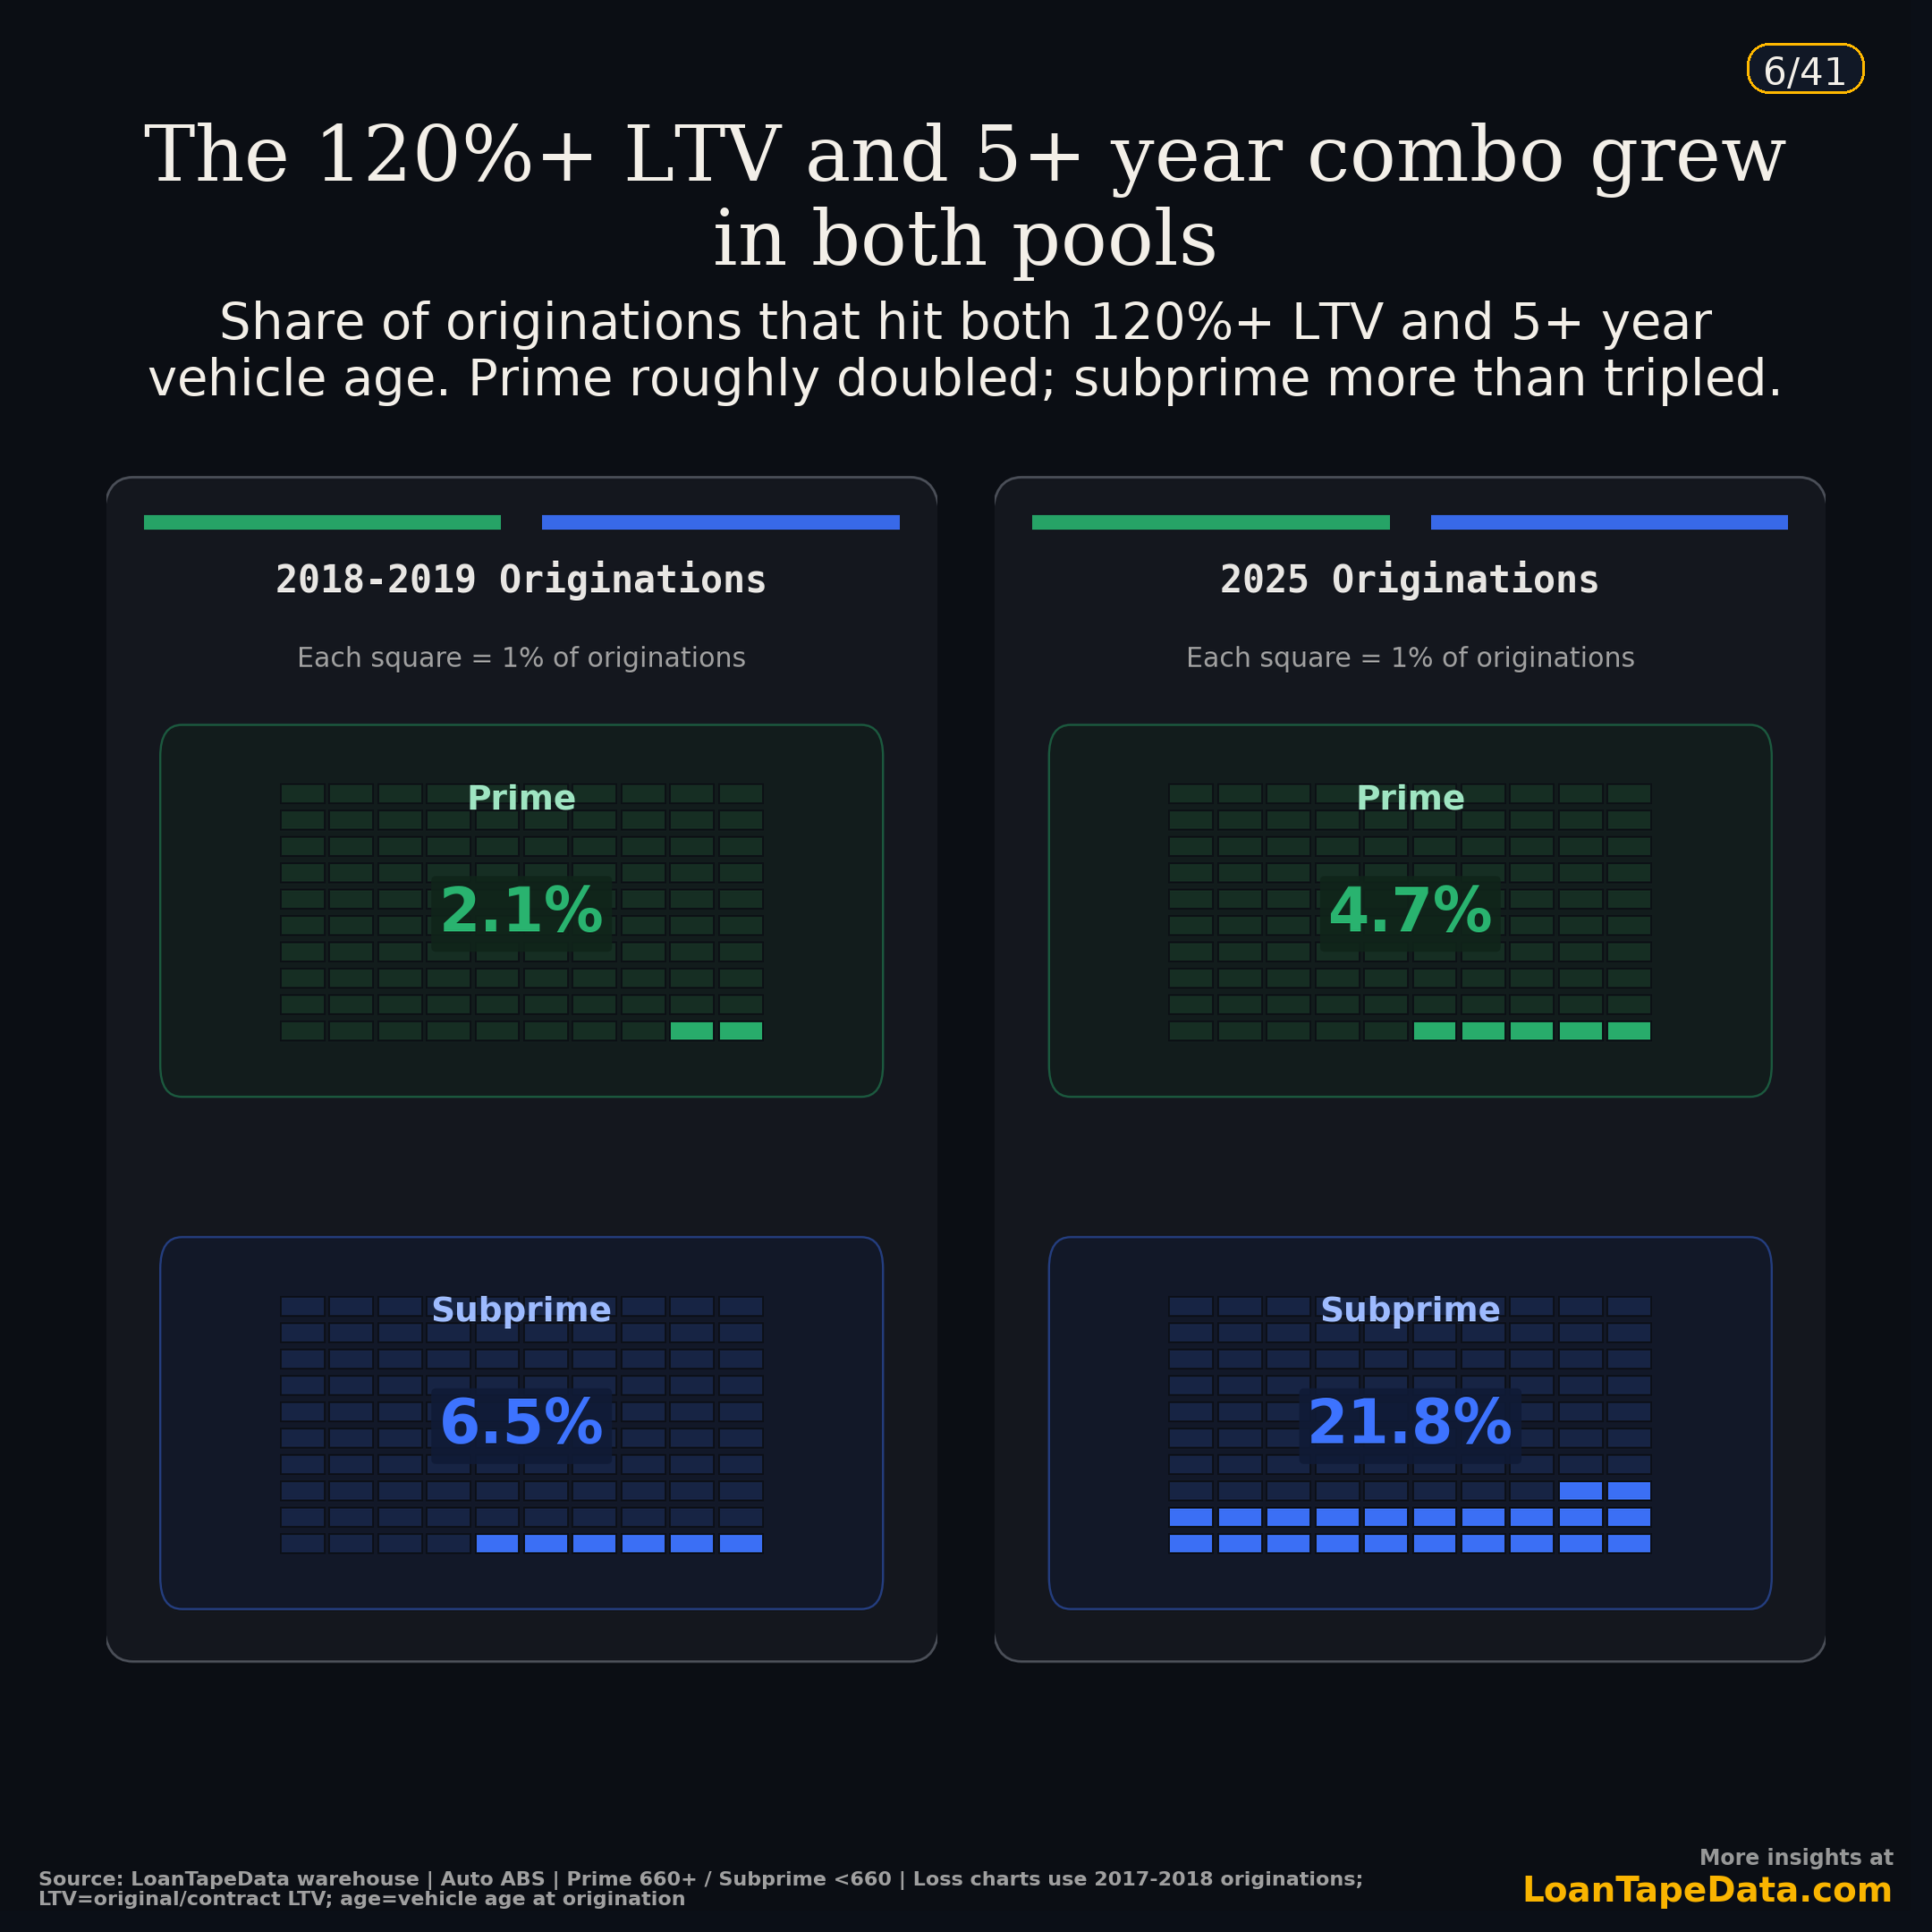
Both pools drifted in the same direction. Subprime drifted considerably further.
Outstanding subprime balances tell the same story
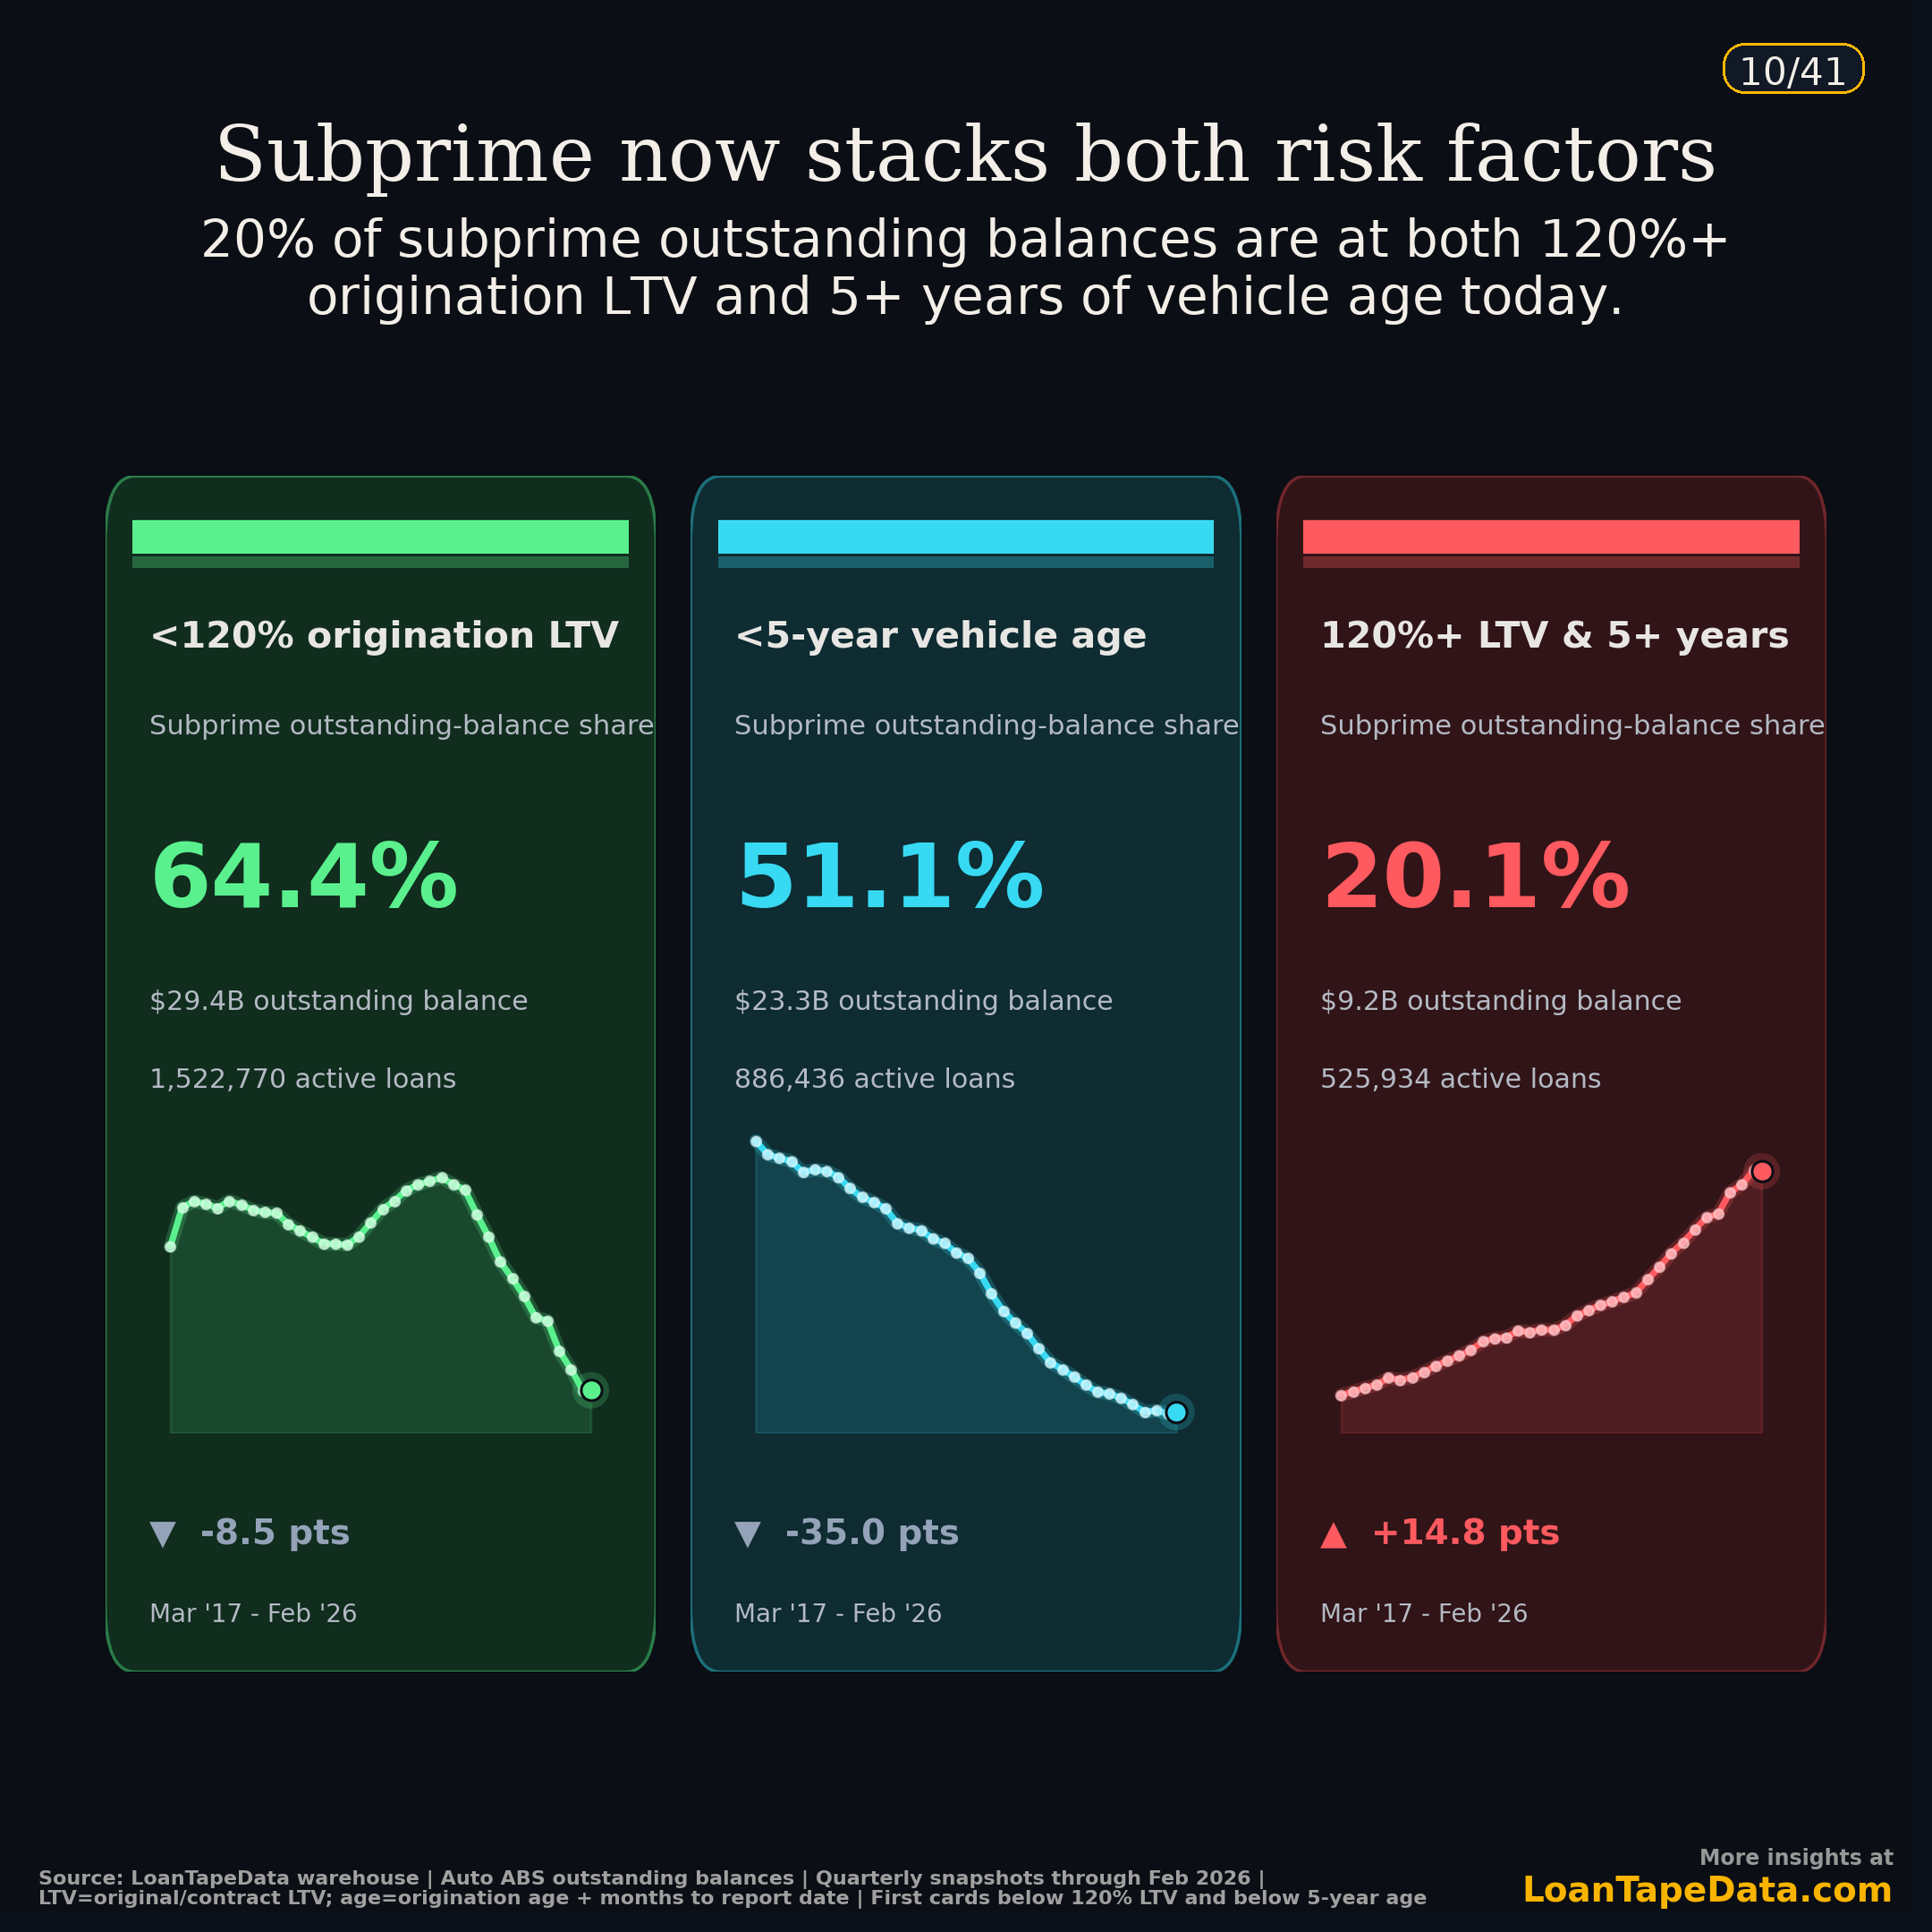
Origination snapshots are one thing. The active book is another. Subprime balances outstanding today have shifted just as far.
Of the roughly $46B in subprime auto ABS balances we track, 64.4% sit below 120% origination LTV. That share is down 8.5 points since March 2017. The share on vehicles under 5 years old has moved a lot more, down 35.0 points to 51.1%. The bucket that hits both flags at once, 120%+ LTV on vehicles 5+ years old, went the other way: up 14.8 points to 20.1%.
That last bucket is $9.2B across 525,934 active loans. Nine years ago it was barely 5% of the book. Today it's a fifth of subprime collateral.
The vehicle-age line is the one I keep coming back to. Just over half the subprime book is on vehicles less than five years old, which means just under half is older. Auctions discount older cars more aggressively, so any repo out of this segment carries higher loss severity than it would have a decade back.
This is a new-loan problem, not an aging-book problem
The obvious read on rising vehicle age is that the existing book is just getting old. That isn't what's happening here.
We decomposed the move from December 2018 to February 2026 for both pools. The math separates four effects: mechanical aging if every loan had survived, runoff of older loans, the seasoning gap between exits and entrants, and entrants arriving on older vehicles.
For subprime, almost all of the move comes from new loans. Average vehicle age at origination for subprime entrants climbed from about 1.83 years (the pre-2019 baseline) to 3.36 years today. That one shift alone pulls 1.54 years onto current pool age, which is why subprime is at 5.25 years rather than something closer to 3.7.
Prime is much calmer. Entrants there arrive on cars 1.12 years old, barely older than the 0.81-year baseline. New loans coming in young roughly cancel the old book aging. Prime drifted from 2.44 to 3.24 years, and that's most of the story.
The starkest cut is on the 5+ year share of new originations. Subprime is writing 49.3% of entrants on cars 5+ years old, against 15.4% pre-2019. Prime went from 8.2% to 17.4% on the same measure. So prime drifted, subprime jumped about three times as far.
What this does to PD and LGD
Two numbers do most of the work in any auto loss model: probability of default (PD), or how likely a loan goes bad, and loss given default (LGD), or how much you actually lose when it does. Expected loss is roughly PD times LGD, applied to the balance at risk. The vehicle-age shift moves both of them the wrong way at the same time, which is the part that worries me.
LGD is the easier one to see, because vehicle age is mostly an LGD story. When a subprime loan charges off, the lender repos the car and sells it at auction, and an older car just sells for less. So an older book runs a higher loss given default per repo before anything else changes. Our 2017-2018 charge-off reference shows median severity rising sharply across LTV bands, and then rising again across vehicle-age bands on top of that. The growing 120%+ LTV, 5+ year tail is dropping balances directly into the LGD bands with the worst historical severity.
Probability of default is harder to reason about, but it is moving too. A higher origination LTV means a thinner equity cushion, so a borrower who runs into trouble is quicker to walk away. An older car also brings repair surprises, and a borrower who is already stretched on payments tends to default faster when the transmission goes. Subprime DQ has kept climbing through 2025 and into early 2026, and the cohorts where it is climbing fastest are the same ones that wrote the most aggressive collateral. PD is drifting up in the loans where LGD already has.
The two effects compound. That is what a 20% stacked-risk book really means: you don't need a recession to lose more per dollar of book than you used to, you just need normal repo flow to grind through a portfolio where both terms are pulling against you. The aging vehicle and the rising delinquency are not two separate stories. They are the same underwriting decision showing up on both sides of the loss equation.
The open question is whether subprime new production rolls back toward newer cars in 2026, or whether 5+ year collateral is just where the market sits now. That mostly comes down to used car prices and dealer incentives, and neither one is currently moving in a direction that would pull the curve back.
Methodology
Pooled auto ABS loans from the LoanTape warehouse. Prime is FICO 660+, subprime is FICO <660. Vehicle age is months since model year. LTV is loan-to-value at origination. Outstanding-balance shares are balance-weighted at quarterly snapshots through February 2026.
Underlying loan-level filings are available through ABS-EE coverage. Subscription tiers are at pricing.