Auto Intelligence: The Auto ABS Read on One Screen
The Auto ABS dashboard has more than thirty views. That structure works when the question is already specific. It works less well on the day a new release lands and the question is simply which numbers moved.
Auto Intelligence is the answer to that question. One Premium view that opens on five numbers, ranks what changed, and lets you go deeper without leaving the page.
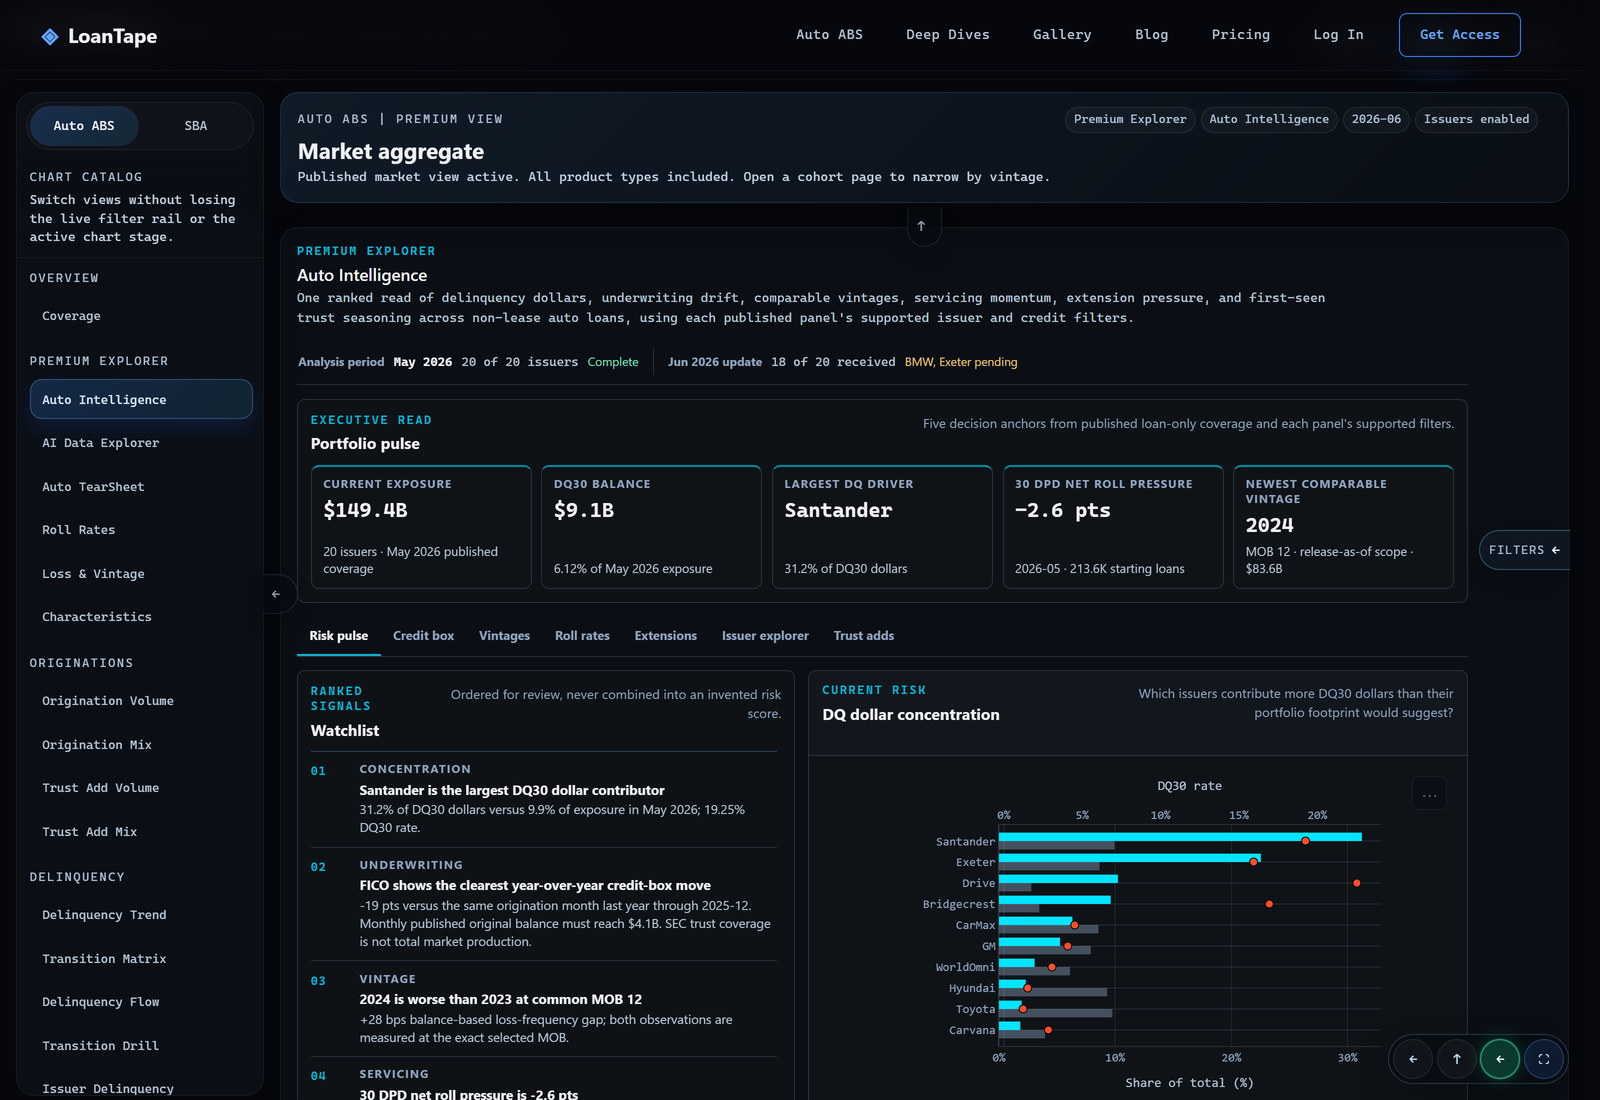
Current exposure on the June 2026 release reads $149.4B across non-lease auto loans in SEC-registered trusts. DQ30 balance is $9.1B, or 6.12% of May 2026 exposure. Santander is the largest single contributor at 31.2% of DQ30 dollars against 9.9% of exposure.
Every panel is loans only. Leases are excluded from the whole workspace rather than filtered out chart by chart, because a lease residual and a loan payoff are not the same event, and mixing them distorts roll rates and loss curves.
Five numbers, then a ranked list
The workspace opens on a portfolio pulse: current exposure, DQ30 balance, the largest DQ driver, net roll pressure, and the newest vintage with a comparable observation. Right now that last one is 2024, measured at 12 months on book (MOB), carrying $83.6B of original balance.
Under the KPIs is a watchlist. It ranks the signals that have enough support to rank, with the underlying values attached. Today it opens on Santander's DQ30 concentration, then a 19-point year-over-year FICO move, then 2024 running 28 bps of loss frequency worse than 2023 at the same age.
The watchlist does not combine those signals into a score. A single 0-to-100 risk number would require a fixed weight between extension activity and DQ30 concentration, and no defensible weighting exists. The signals stay separate and ordered instead, so the ranking can be inspected and disputed one input at a time.
Seven tabs, seven questions
| Tab | The question it answers |
|---|---|
| Risk pulse | Which issuers carry more DQ30 dollars than their footprint implies? |
| Credit box | Are underwriting terms and borrower profile drifting together, or is one field doing the work? |
| Vintages | How does every vintage look at the same exact age? |
| Roll rates | Are balances migrating toward cure or toward deeper delinquency? |
| Extensions | Where is extension use high and the Extension Default Rate also high? |
| Issuer explorer | What do the issuers I actually cover look like, individually? |
| Trust adds | Is new trust balance coming from current production or from older paper? |
Vintages
The vintage checkpoint filters to one exact months-on-book value before aggregating, then colors every cell against the median of all published vintages at that same age.
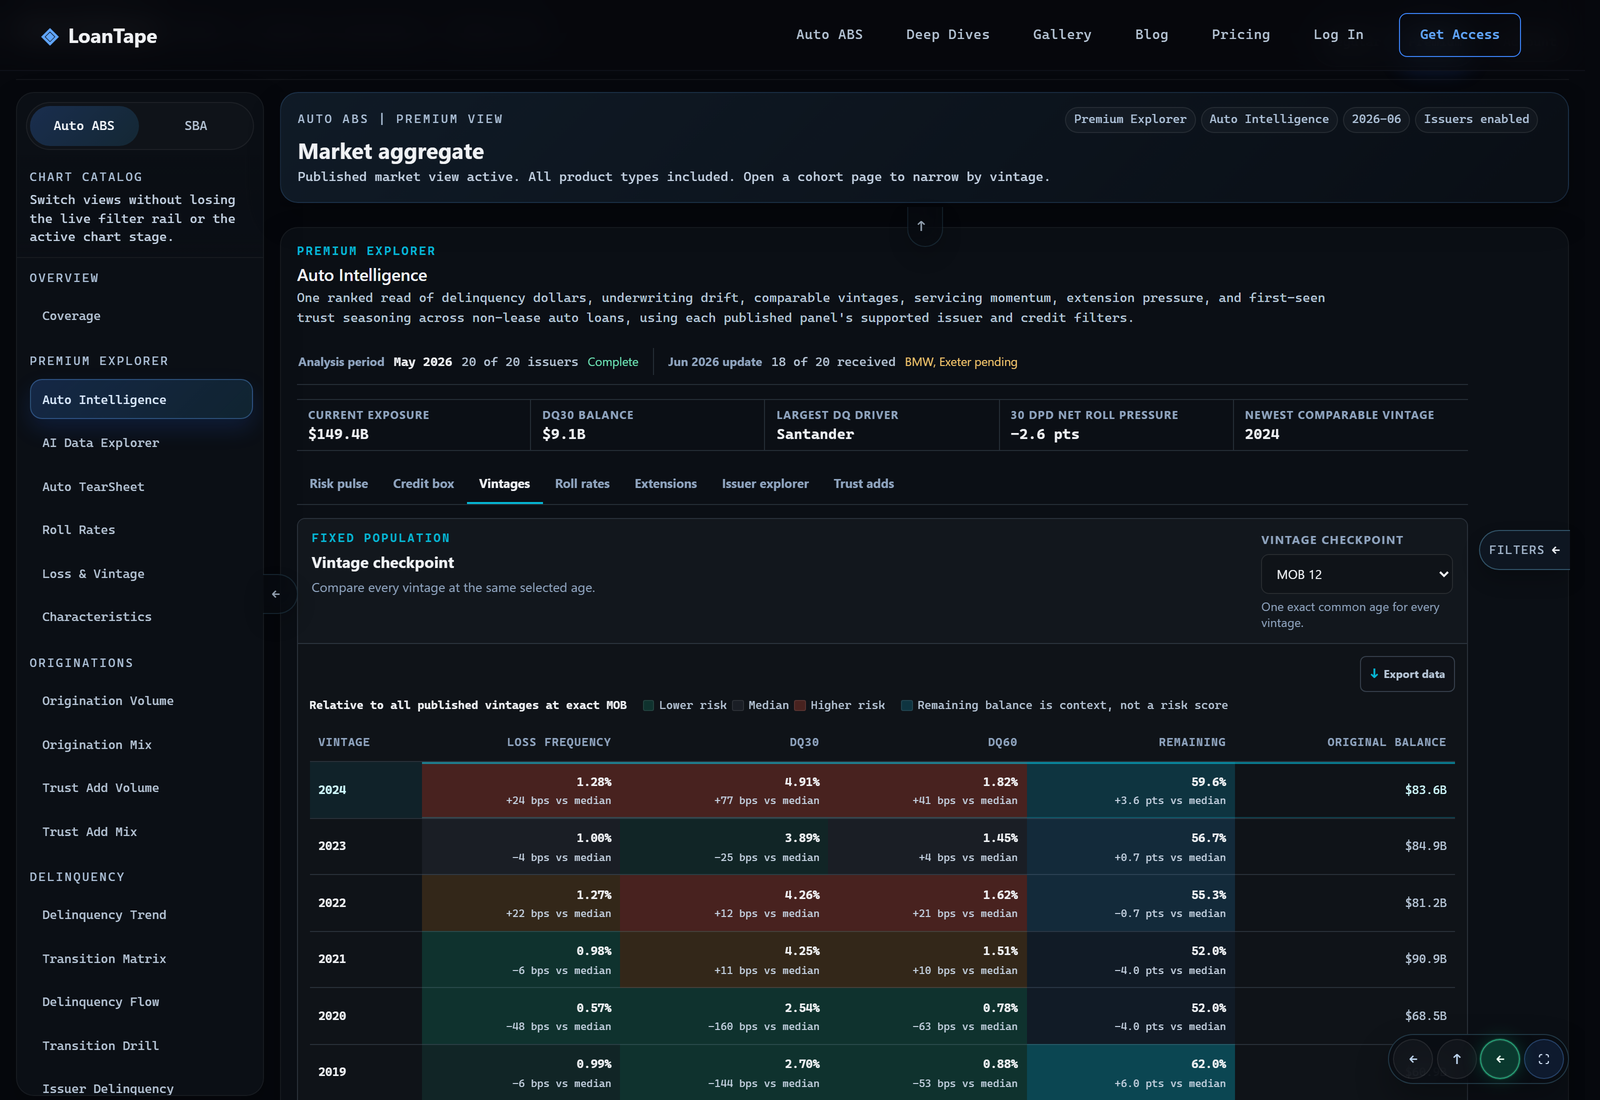
At MOB 12, 2024 runs 1.28% loss frequency against 2023 at 1.00%, and its DQ30 sits 77 bps above the median. 2020 is the outlier in the other direction at 0.57%.
The filter-before-aggregate ordering matters. Aggregate first and filter after, and the vintages that survived longest set the comparison population, so every older cohort looks better than it was. Checkpoints are MOB 6, 12, 18, and 24, and a vintage without an observation at the selected age stays blank.
Credit box
Credit box rebases average FICO, loan-to-value (LTV), term, loan size, and payment-to-income (PTI) to 100 at a month you pick, because the useful comparison is rarely "versus the oldest month we have."
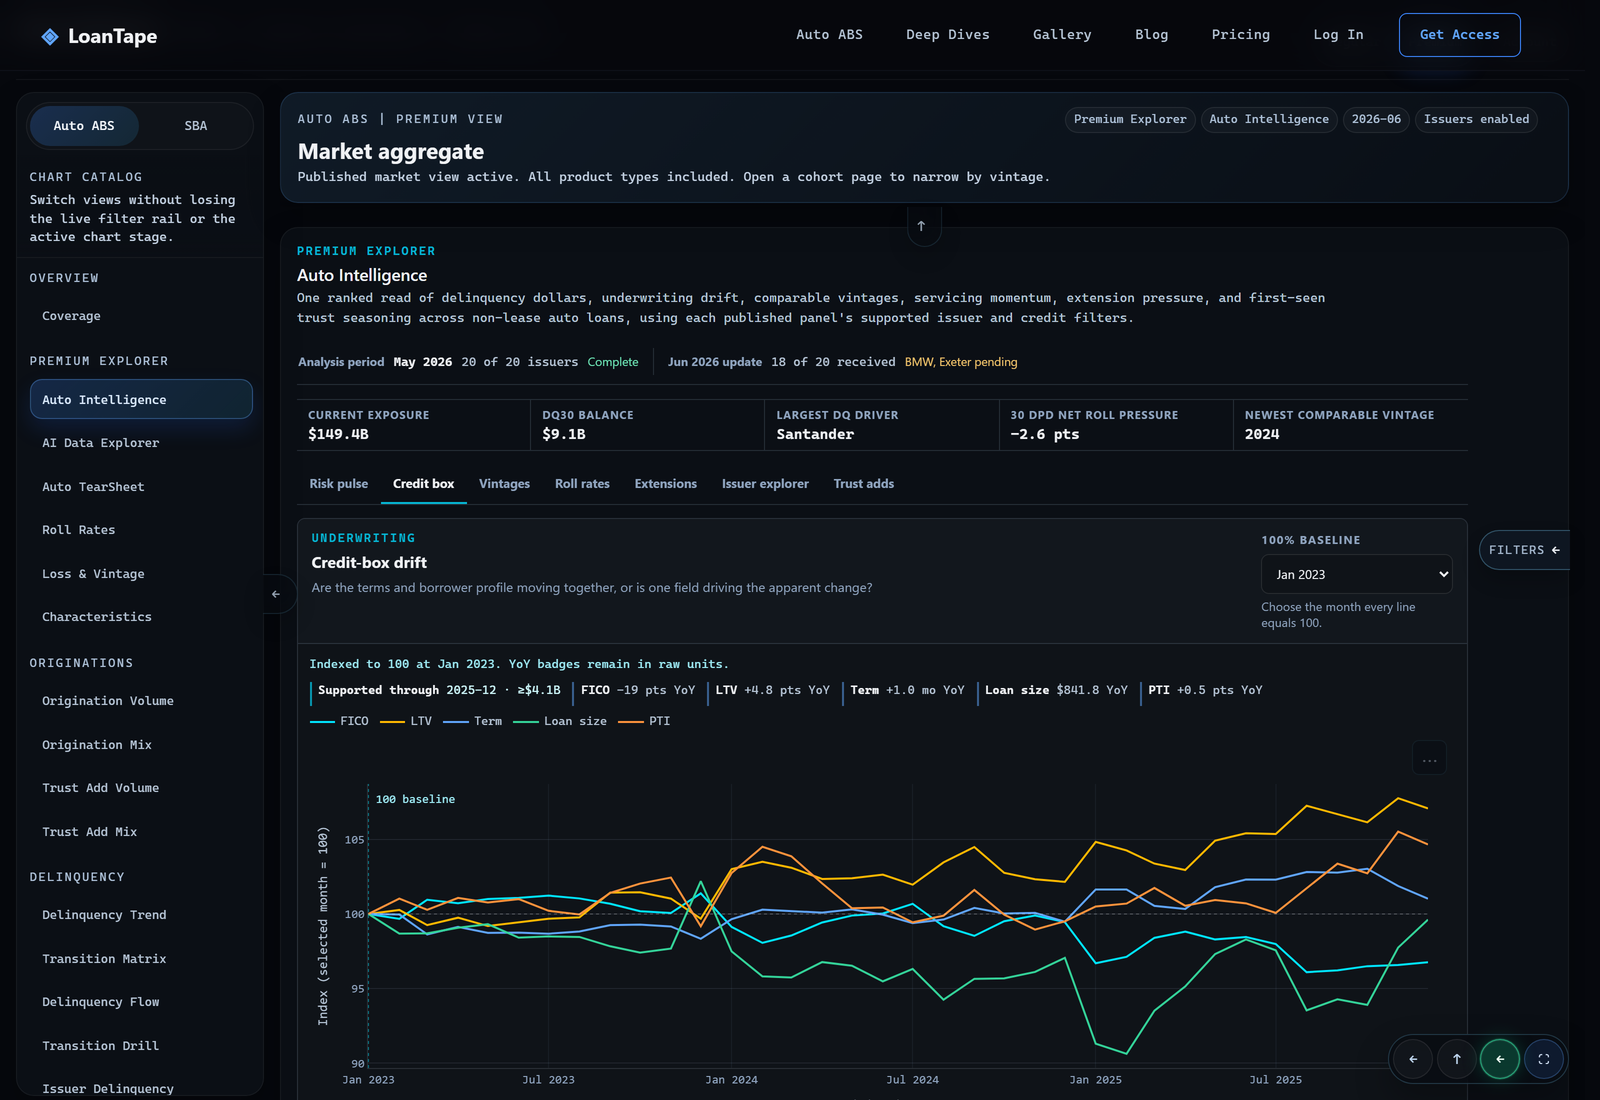
Indexed to January 2023, the badge row reads FICO −19 points year over year, LTV +4.8 points, term +1.0 month, loan size +$842, PTI +0.5 points. Every field is moving the same direction, which is a different story than one field dragging an average around.
A month only enters the series when its published original balance reaches at least half the median of the last twelve months that have had a full year to season. That keeps a thin filing month from creating a fake inflection.
Issuer explorer
The August 2 release added the piece people asked for immediately after launch: search for the issuers you cover.
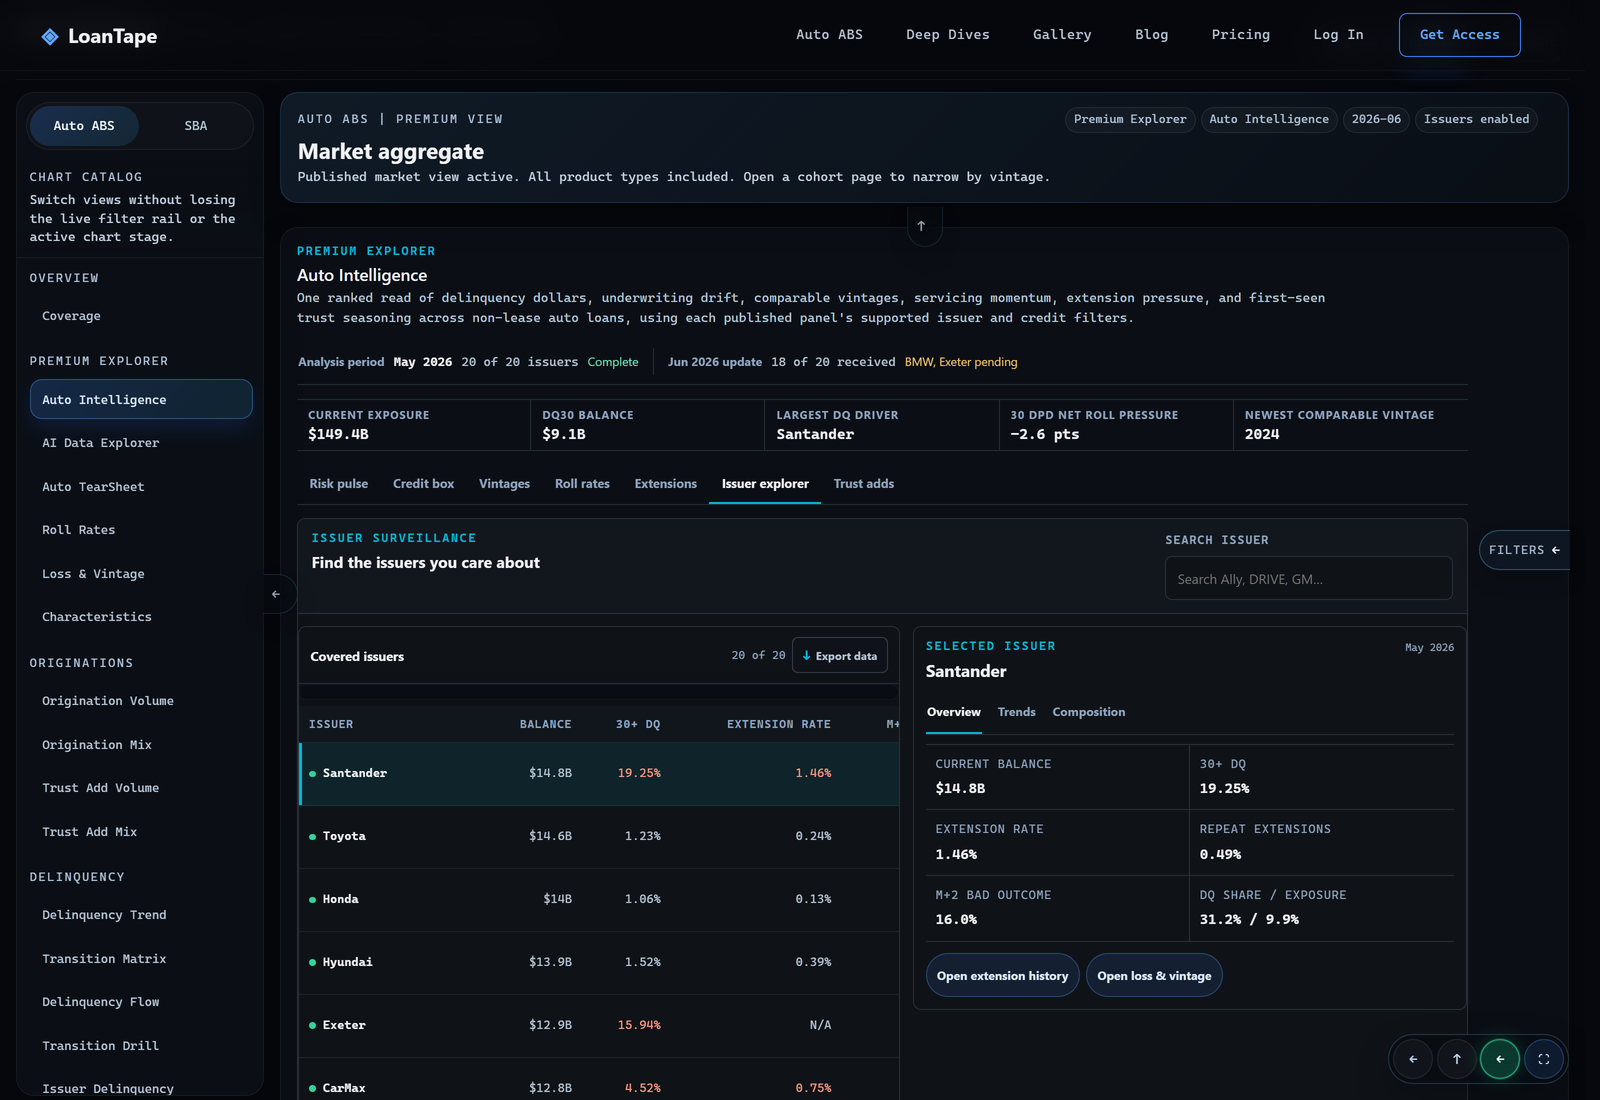
Twenty issuers, each with balance, 30+ DQ, extension rate, and M+2 bad outcome. Open one and you get delinquency and extension trends plus a composition breakdown across FICO, term, LTV, PTI, and vehicle age. Santander shows $14.8B at 19.25% 30+ DQ; Toyota shows $14.6B at 1.23%. The issuer and composition tables export to CSV from the table itself.
Missing metrics stay blank. We do not carry a stale value forward to fill a cell.
The rest
Risk pulse reconstructs DQ30 dollars from each issuer's published balance and DQ30 rate, so no percentage is averaged with another percentage. A drilldown ranks FICO by term by LTV cells by the DQ30 dollars they contribute, which starts the risk-layering review from materiality rather than from whichever cell shows the highest rate on a $12M slice.
Roll rates takes a starting state from Current, 1-29, 30, 60, or 90+ days past due (DPD) and splits the following month into cure, worsen, and net pressure. The denominator is the full starting-state balance. Unchanged balances stay in it, and so do terminal exits that are not charge-offs.
Extensions plots issuer extension event rate against the Extension Default Rate, the share of extension cohorts reaching 30+ DPD or charge-off by month two. The method note states that this is an association between two published rates, not a measure of extension effectiveness. Servicers choose which loans to modify, and plotting the two rates against each other does not remove that selection effect.
Trust adds breaks each first-seen month into origination vintages. Trust-add month is not origination month, and the gap between them is often the story.
Coverage is stated, not implied
Two clocks run through this data and the workspace refuses to pretend otherwise. The header says so directly: analysis period May 2026 with 20 of 20 issuers complete, and a June 2026 update with 18 of 20 received, BMW and Exeter pending.
Risk pulse is anchored to the latest complete published month. Vintages report against the selected release as-of, which can include a partial month where only the early filers have landed. Those two surfaces will not tie to the dollar, and forcing them to tie would mean either discarding fresh data or overstating coverage.
So there is a reconciliation panel that shows the residual, with the timing and scope difference exposed rather than smoothed. The difference gets quantified on the page instead of surfacing later as two slides that do not agree.
It is also why current exposure reads $149.4B rather than something larger. Earlier builds mixed partial-release exposure into the same figure, which overstated coverage.
What it will not do
It will not build a composite risk score, fill missing performance forward, average rates across cells of different sizes, or attribute an outcome to an extension from a cross-sectional chart. A point with missing or zero starting-loan support is withheld and labeled rather than rendered as a zero.
Getting to it
Auto Intelligence is a Premium view. The regular dashboard tier shows a locked preview of the layout so you can see the shape of it before deciding, without exposing the observations.
Premium and Enterprise subscribers can open it now in the dashboard. It runs on the same normalized ABS-EE loan-level data as everything else on the platform, so nothing in it comes from a separate model or a side file.
If you would rather build your own cuts than read ours, the AI Data Explorer covers that workflow. For the three Premium pages the roll and vintage tabs are compressed from, see Roll Rates, Loss & Vintage, and Characteristics. And for the analysis that pushed net roll pressure onto the front page, start with why delinquencies are lasting longer.
Pricing is on the pricing page.