Roll Rates, Loss & Vintage, and Characteristics
A roll rate is only as good as its denominator. Compute one on loan counts and a small balance that cures offsets a large balance that charges off, one for one. That is a reasonable way to describe borrower behavior and a poor way to describe where money is going.
Three Premium pages now sit in the Auto ABS dashboard, and every number on all three is a balance ratio: Roll Rates, Loss & Vintage, and Characteristics. They run on two published history families that we added to the release contract rather than to a side file. Transition history carries 36 report months of balance migration. Cohort loss history carries annual vintage curves by months on book (MOB).
Roll Rates: where balances actually go
Pick a starting delinquency state, pick what counts as the outcome, and pick what the lines represent.
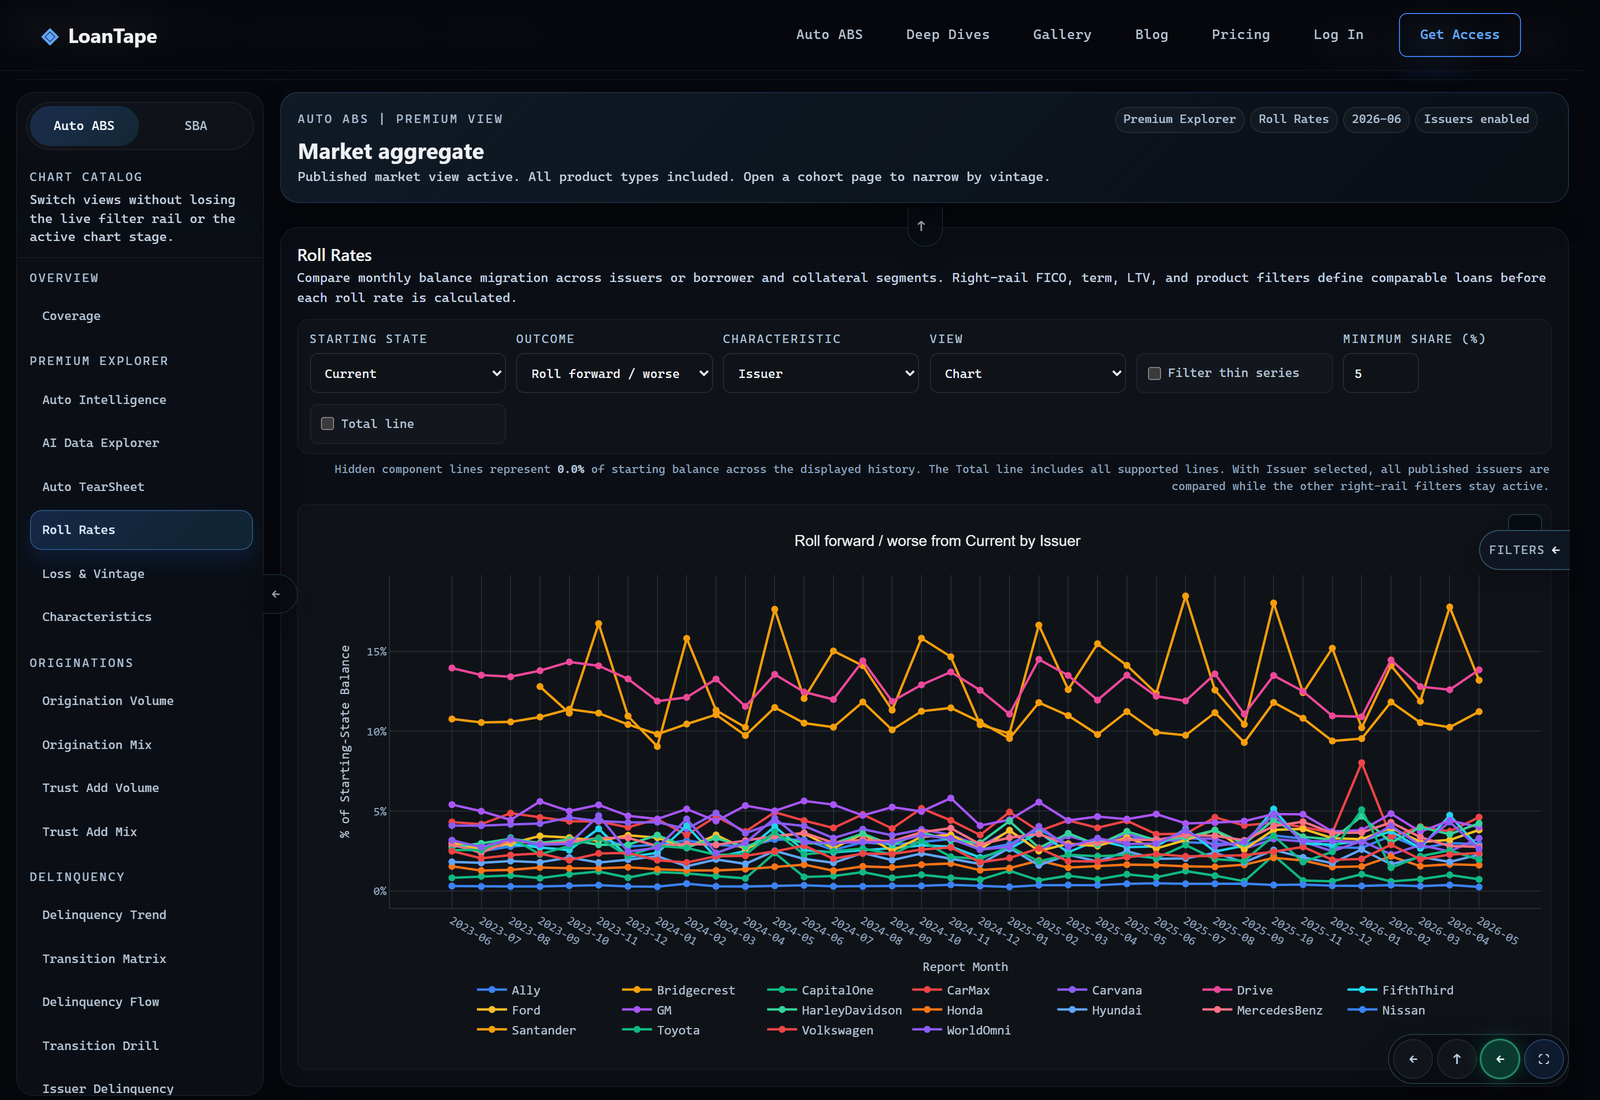
Outcomes are explicit mappings rather than one hardcoded definition: roll forward / worse, improve / cure, remain in the starting state, charged off, or principal reduction.
Lines can be issuers or any one of twelve borrower and collateral characteristics. Issuer is the default, because the first question is usually which servicer is behaving differently. In the chart above, rolling forward from Current, Drive and Bridgecrest sit in a band around 10-15% while the rest of the market clusters below 6%. The spread between those two groups is wider than the movement inside either one over three years.
Two controls exist because real characteristic breakdowns are lopsided. A minimum-share filter drops series below a balance-share threshold you set, and the page reports what share of starting balance those hidden lines represented across the displayed history. The share of balance behind the displayed lines is therefore always stated rather than assumed. An optional Total line reuses the same artifact, weighting each component rate by the bucket's full starting balance rather than averaging component rates together.
The FICO, term, loan-to-value (LTV), and product controls in the right rail are real query filters applied before aggregation, not display toggles. Comparing subprime issuers means the peer set is filtered to those loans on both sides of the ratio.
Loss & Vintage: twelve metrics on a fixed cohort
The Loss & Vintage page follows a vintage as it seasons across twelve metrics.
| Loss and recovery | Balance and paydown | Delinquency |
|---|---|---|
| Balance-Based Loss Frequency | Principal Reduction % | DQ30 Balance % |
| Cumulative Gross Loss % | Remaining Balance % | DQ60 Balance % |
| Cumulative Net Loss % | Defaulted Original Balance | DQ90 Balance % |
| Cumulative Gross Loss | ||
| Cumulative Net Loss | ||
| Cumulative Broad Recoveries |
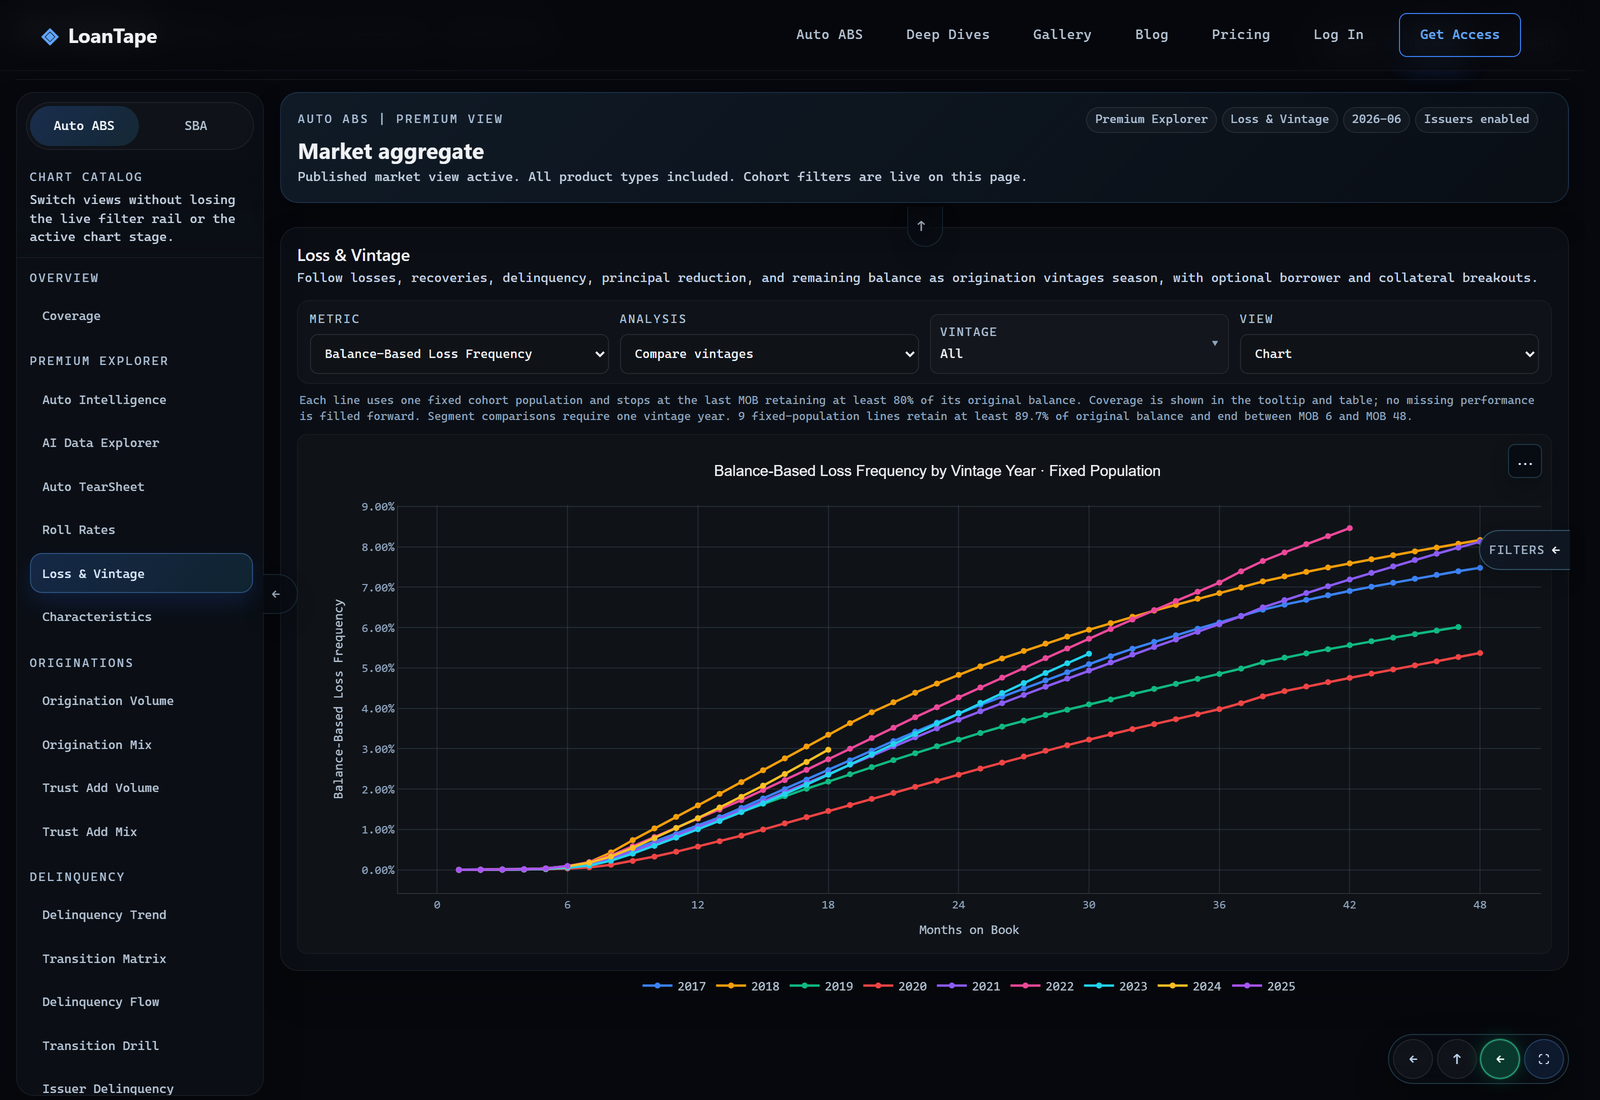
The headline loss-frequency metric is cumulative defaulted original balance divided by cohort original balance. Loan counts ride along as a support series so you can see how thin a point is, but a count never weights a displayed rate and never becomes a denominator.
Two modes: compare vintages against each other, or compare segments inside one vintage year. Segment mode requires a single vintage year and defaults to the newest year with at least two segment values that have real support.
The endpoint rule determines where each line stops. Each line uses one fixed cohort population and ends at the last MOB where that population still retains at least 80% of its original balance. In the chart above that means nine lines ending at different points between MOB 6 and MOB 48, rather than every curve running to the right edge. Beyond that boundary a curve describes survivors instead of the cohort, and cumulative loss measured on survivors understates the cohort. Coverage shows in the tooltip and the table, nothing is filled forward, and vintages without an observation stay missing rather than being interpolated into place.
We also do not derive calendar loss by dropping MOB from these rows. Cohort denominators repeat across months, so that aggregation is invalid. A calendar view needs its own beginning-balance contract, and it will get one.
Characteristics: what ranks where
The Characteristics page ranks values within a characteristic on current balance, original balance, or DQ30, DQ60, and DQ90 balance rates.
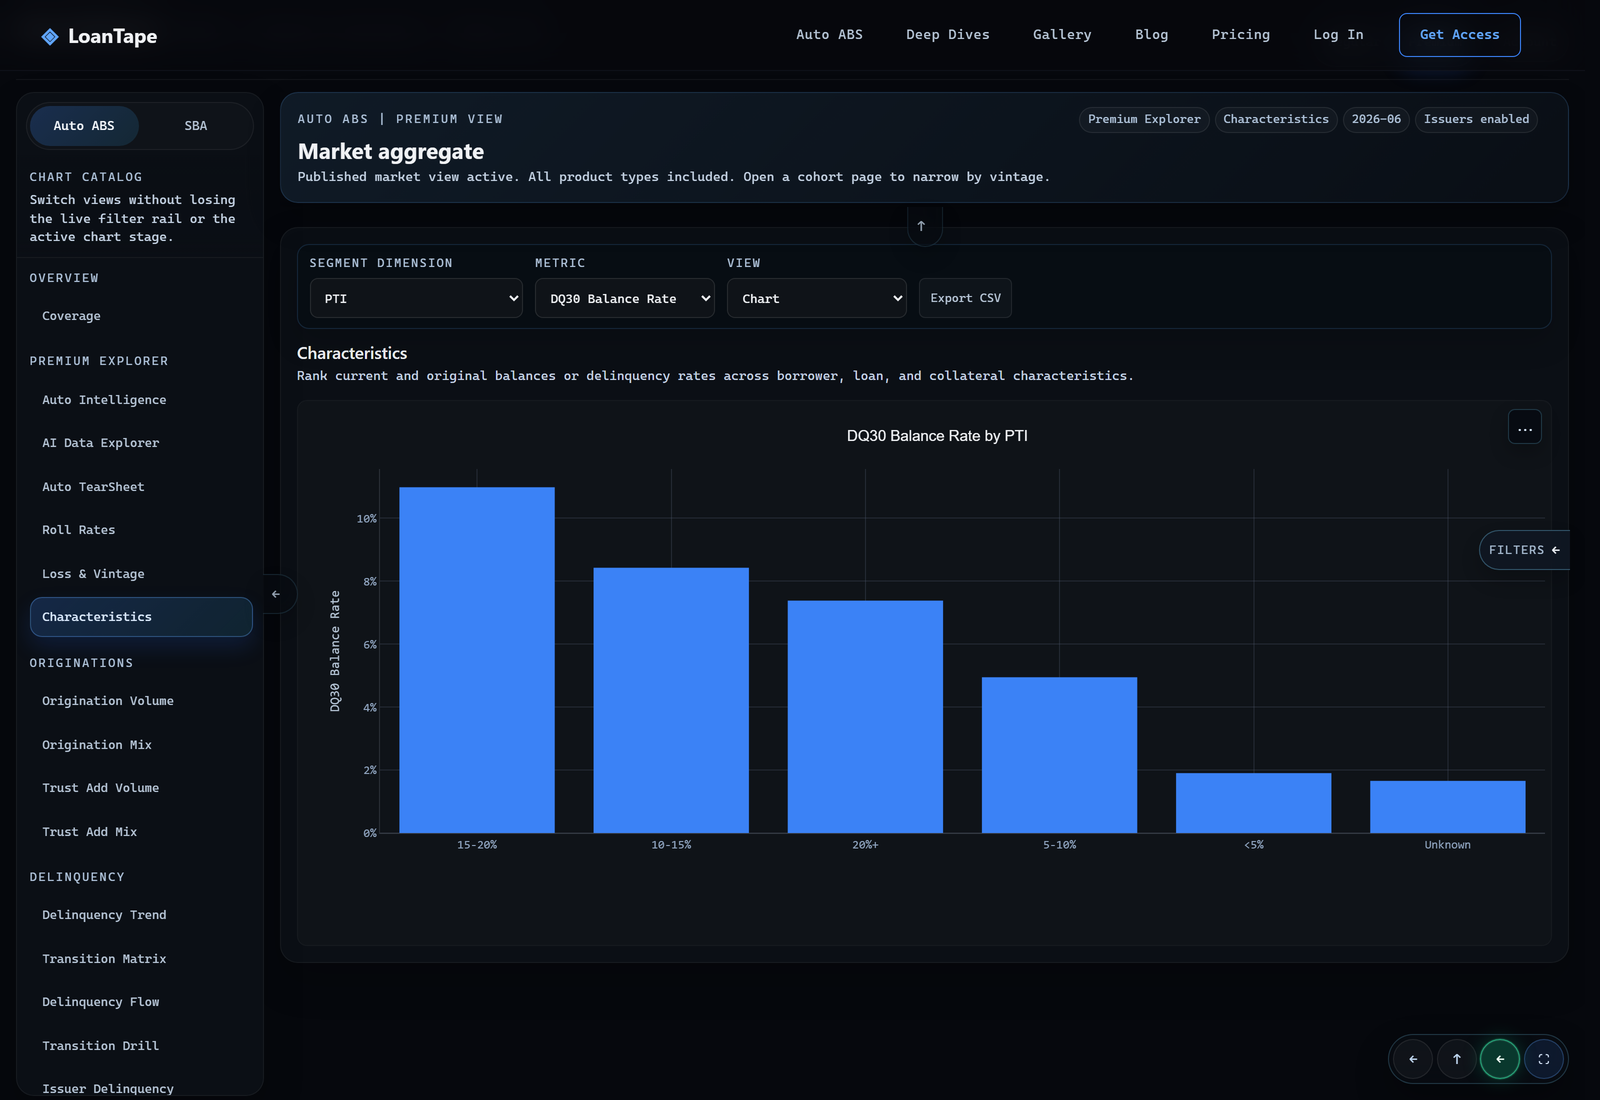
The page answers attribution questions: whether elevated delinquency tracks vehicle condition, payment-to-income (PTI), or co-obligor status.
The PTI cut above shows why the ranking is worth running. DQ30 rises from under 2% below 5% PTI to nearly 11% in the 15-20% band, then falls in the 20%+ band. The highest PTI band is not the highest delinquency band. Whether that reflects credit-box compensation, balance mix, or population differences is a separate question, and the right-rail filters are where it gets tested.
The twelve characteristics
All three pages draw from the same readiness-gated set:
Borrower and loan: fine FICO, PTI, co-obligor status, employment verification, income verification
Collateral: vehicle age, vehicle condition, vehicle type, vehicle origin, electric vehicle flag, truck duty class, truck series class
Coarse FICO, term, and LTV are a fixed filter spine that sits beside exactly one of these at a time. The publisher never crosses two characteristics.
That constraint is deliberate. A general characteristic-by-characteristic cube would multiply publish cost and query latency for cells that mostly hold too little balance to say anything. Spine plus one facet keeps the interesting intersections available: you can look at fine FICO bands inside a selected coarse FICO bucket, and the two fields keep their own meanings rather than one being remapped onto the other.
Vehicle origin means brand-origin region, not assembly country and not VIN decoding. The electric flag is conservative, covering all-electric brands and clear battery-electric model evidence, with plug-in hybrids excluded unless the raw model text is explicitly electric. Those definitions live in the product, in the method notes, next to the numbers.
What this replaces
These pages replace an ad hoc request. A question like whether 60-day cures have deteriorated for one issuer inside one FICO band previously required an analyst pull, and the answer arrived days later with a denominator that could not be reconstructed.
These pages return it in the browser, from the same normalized ABS-EE loan-level data and monthly remittance filings that back every other view, through the same query path with the same disclosed method.
All three are Premium views, under Premium Explorer in the Auto ABS dashboard sidebar. If you want the ranked read across all of them at once, that is what Auto Intelligence is for.
Plans and access are on the pricing page.