Pricing · Three Plans, From $99 a Month · SBA Alone From $15
SBA only? Plans from $15 a month →
Every auto plan reads the same 29.7 million auto loans, and includes SBA
The plans differ in what you do with the data. Dashboard Access lets you explore it, Premium lets you export it and read the deep-dive decks, and Enterprise adds an analyst’s time.
| Dashboard Access | Explore the auto ABS and SBA dashboards | $99 |
|---|---|---|
| Premium Analytics Most Popular | Adds CSV exports, the AI analyst and the deep-dive decks | $299 |
| Enterprise | Adds 4 hours a month of a human analyst | $999 |
| SBA-only plans | Three plans for SBA loan data alone, without auto ABS | $15–$200 |
Fig. 1 Vehicle Collateral and LTV deep dive, page 37 of 41
Prime loans written above the car's value fall behind far more often
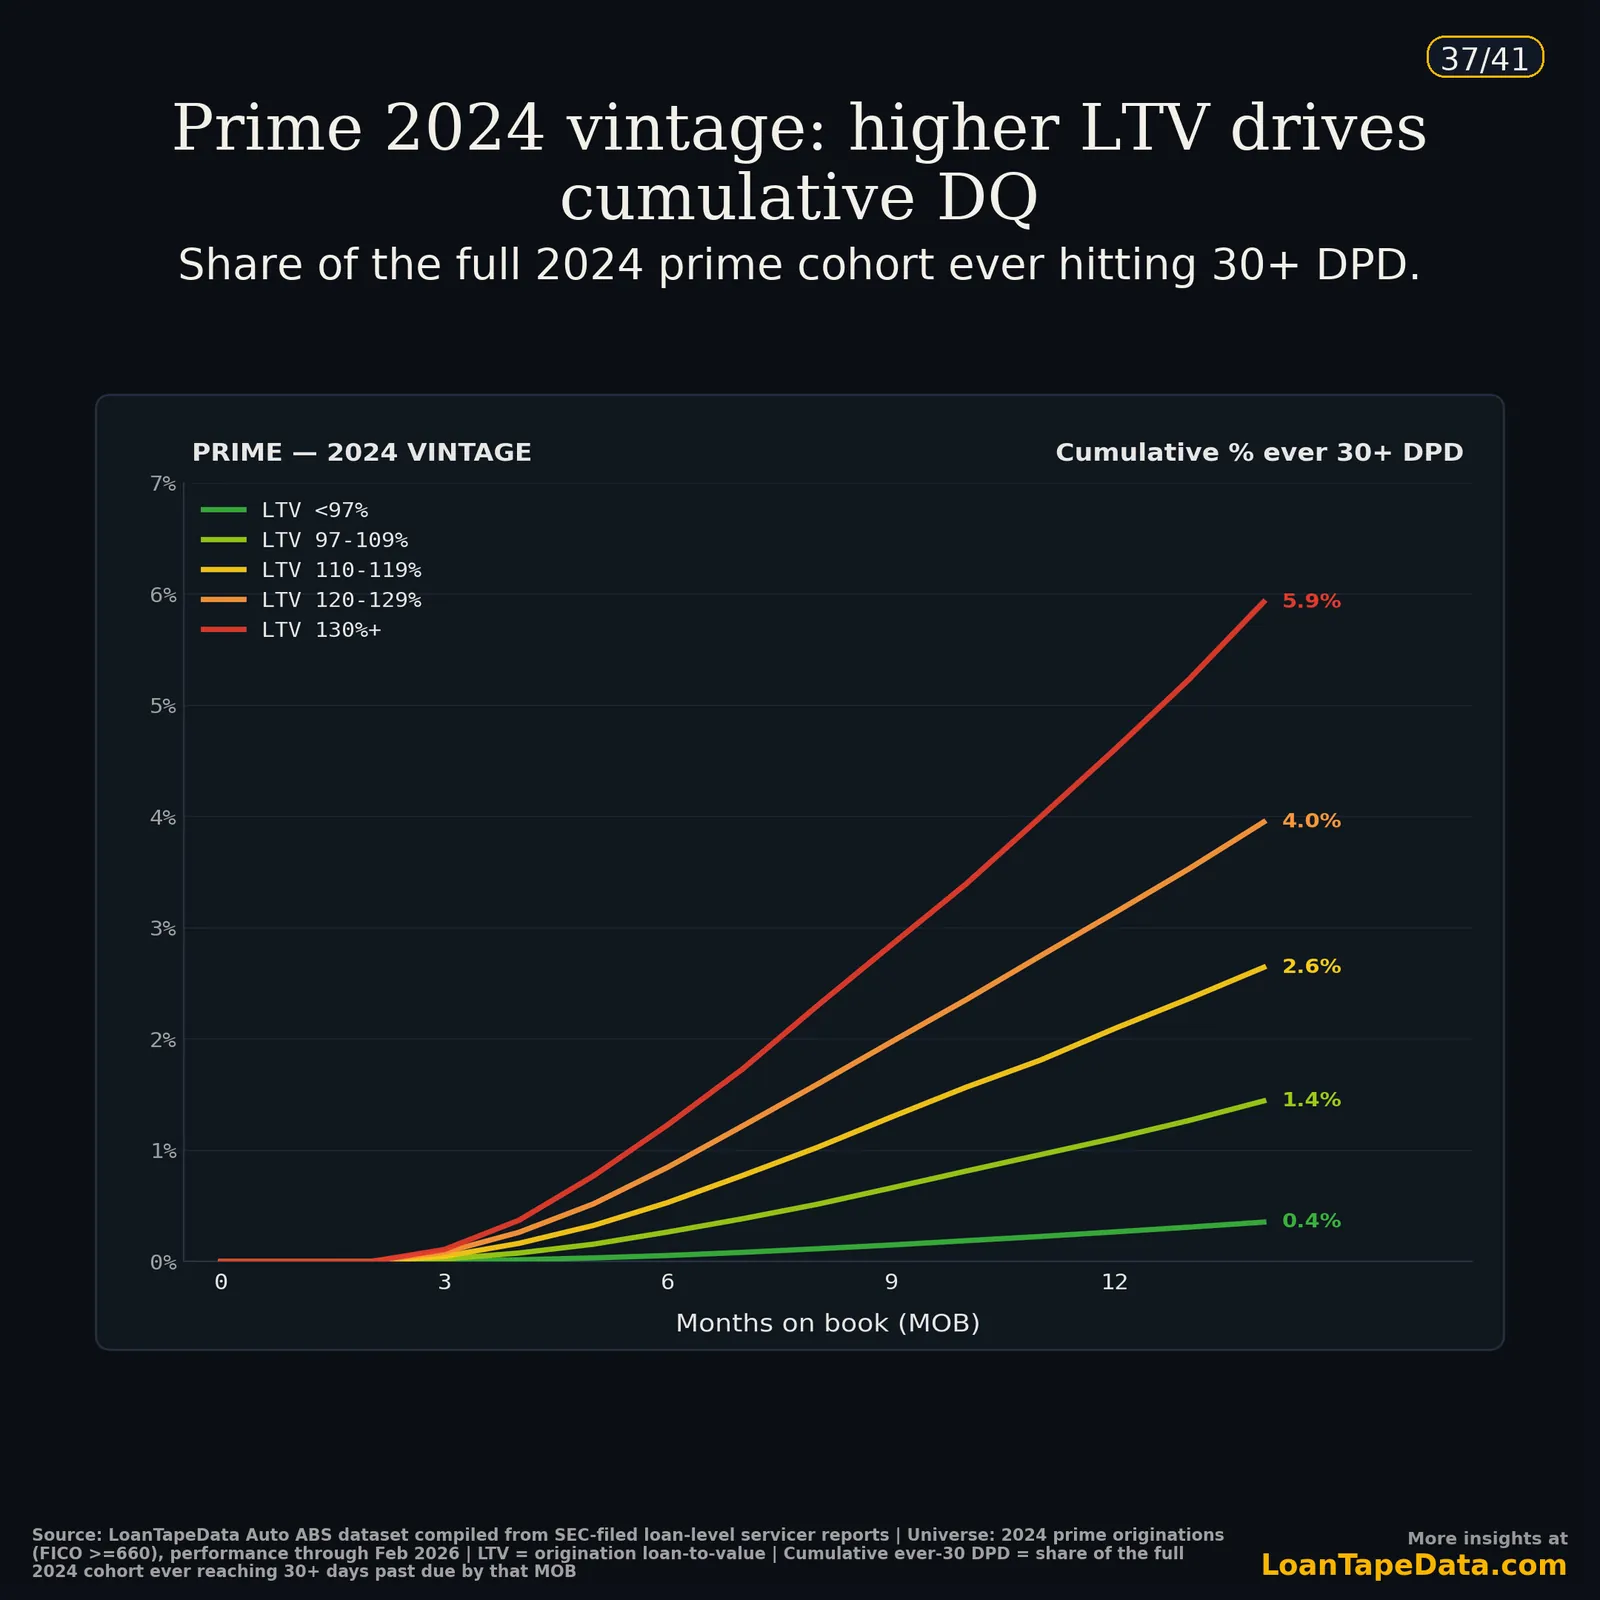
By month 14, 5.9% of 2024 prime loans above 130% LTV had been 30+ days late, against 0.4% under 97% LTV.
Plans
Prices are in US dollars a month. Checkout and payment are handled by Stripe.
Dashboard Access
Interactive Auto ABS and SBA dashboard visuals with monthly email digest
$99a month
- Interactive Auto ABS dashboard visuals
- FICO, issuer, transition, and geographic views
- Data Explorer visual queries
- Includes SBA Dashboard Access
- Monthly data refresh
- Vintage loss curves & balance-based loss frequency
- Roll-rate heatmaps
- Monthly email digest with charts
Try it first in the live demo, on sample issuers.
Choose Dashboard AccessPremium Analytics
Dashboard visuals plus CSV exports, the AI analyst and the deep-dive decks
$299a month
- Everything in Dashboard Access
- CSV/data export from dashboard and explorer views
- AI Data Explorer prompt workflows
- AI analyst that answers questions about the data
- Issuer-specific deep-dive analysis
- Vintage cohort comparisons
- Deep-dive decks to read and download
- Includes SBA Premium: loan-level SBA rows, Growth Radar
Includes the deep-dive decks. See nine figures from them.
Choose Premium AnalyticsEnterprise
Everything in Premium plus a dedicated human analyst
$999a month
- Everything in Premium Analytics
- Dedicated human analyst (4 hrs/mo)
- Custom research requests
- Performance benchmarking vs. market
- Includes SBA Enterprise (10,000-loan SBA exports)
- Priority support
For team access or custom work, write to [email protected].
Choose EnterpriseEach plan opens a check of the data it includes, then Stripe checkout. Which lenders, loans and months are included
SBA loan data alone
Only need SBA 7(a) and 504 data? Three SBA-only plans: SBA Dashboard Access $15 → SBA Premium $50 → SBA Enterprise $200 a month. They do not include the auto ABS data.
What data you get
All three auto plans are built on the same auto loan data. Premium adds issuer drill-downs, exports and the AI analyst.
The data covers 20 lenders, 4 of them subprime, and 29.7 million loans with loan-level history, reported monthly from Dec 2016 to Sep 2026. In the latest month 7,386,838 of those loans were still active, with $141.1 billion outstanding.
Source: LoanTape data release through September 2026, built from the loan-level data public auto ABS trusts file with the SEC on Form ABS-EE. The counts update with each release.
- Ally
- BMW
- Bridgecrestsubprime
- Capital One
- CarMax
- Carvana
- Drivesubprime
- Exetersubprime
- Fifth Third
- Ford
- GM
- Harley-Davidson
- Honda
- Hyundai
- Mercedes-Benz
- Nissan
- Santandersubprime
- Toyota
- Volkswagen
- World Omni
What is not here. The data covers SEC-registered public auto loan ABS first offered on or after November 23, 2016. Those are the deals the SEC requires to file loan-level data. Rule 144A and other private deals and public deals offered before that date file none, and loans that were never securitized are not filed at all, so no public source has loan-level data for them.
Inside the deep dives
Premium subscribers get the decks these figures come from. Open a figure to see the page at full size; it zooms to the number quoted under it.
Fig. 2 Auto Monitor, Sep 2026 · p. 34/157
More prime balance 90+ days late is staying put than in 2017-2019
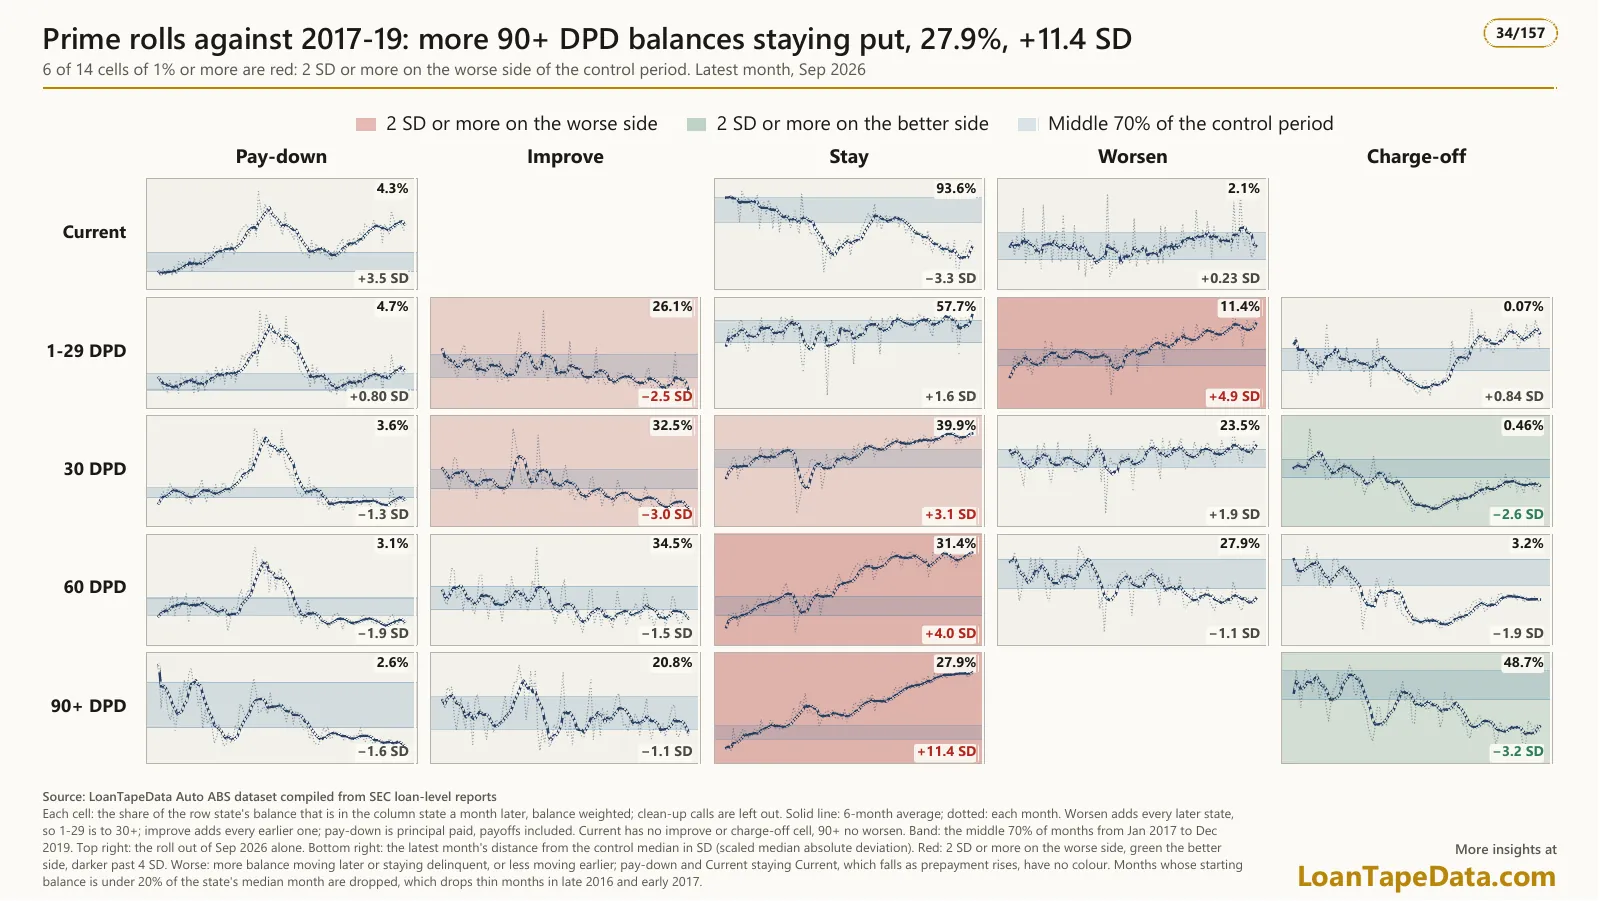
In September 2026, 27.9% of prime balance 90+ days late stayed there, +11.4 SD against 2017-2019.
Fig. 3 Auto Monitor, Sep 2026 · p. 30/157
Half of prime balance 90+ days late charges off within a month
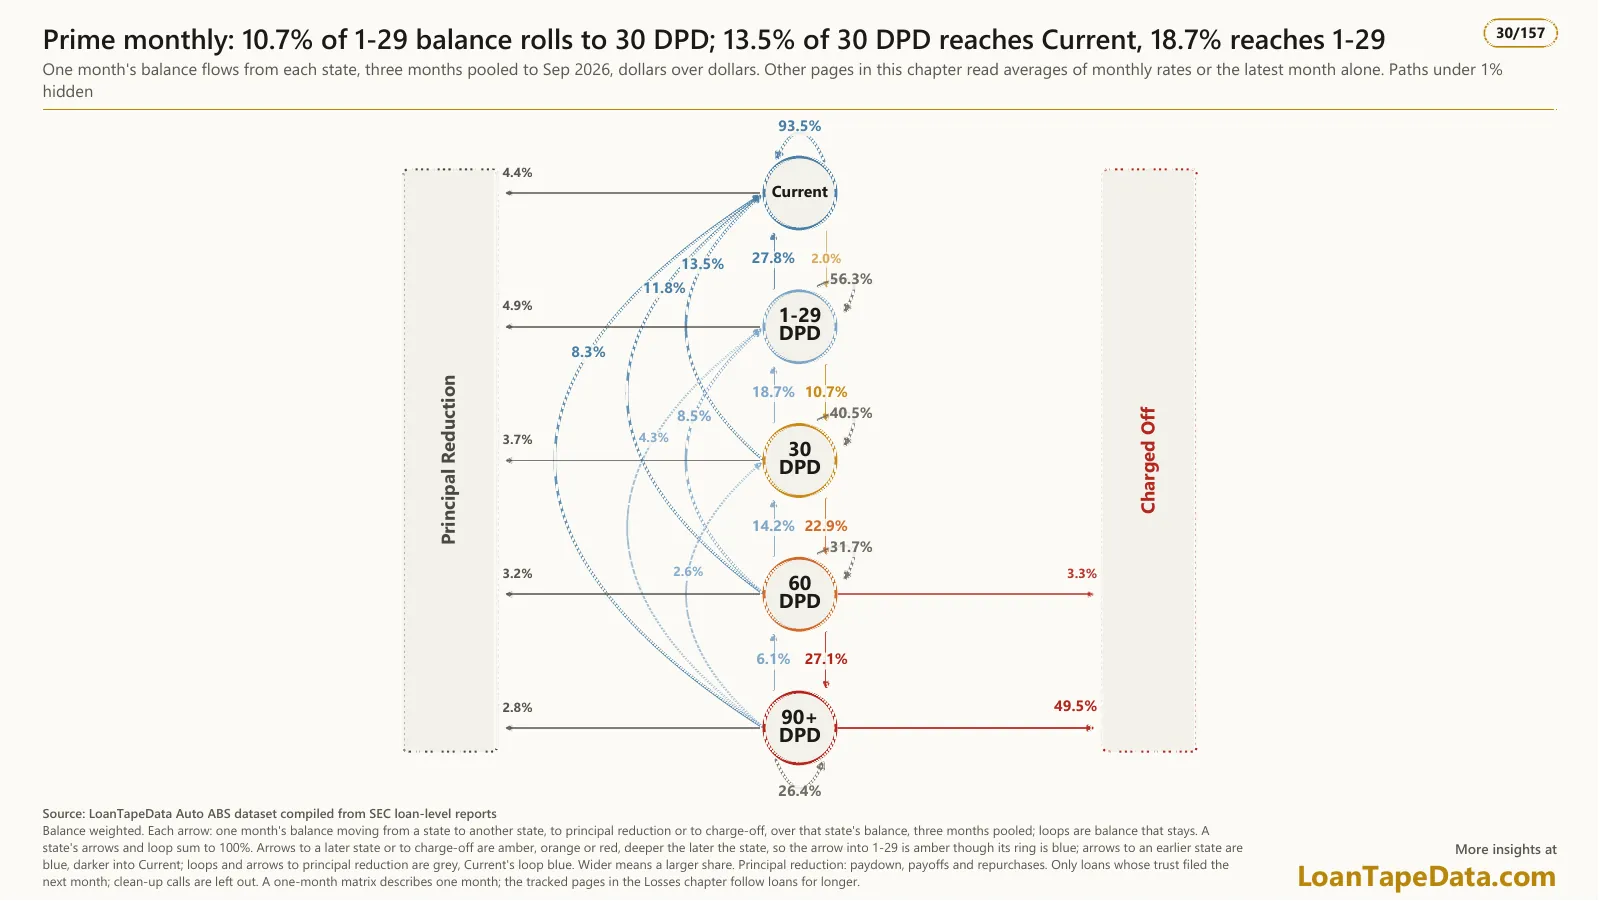
From 90+ days past due, 49.5% of prime balance charged off within a month; 93.5% of current balance stayed current.
Fig. 4 Auto Monitor, Sep 2026 · p. 28/157
Subprime delinquency rose most in Kentucky, against the nation
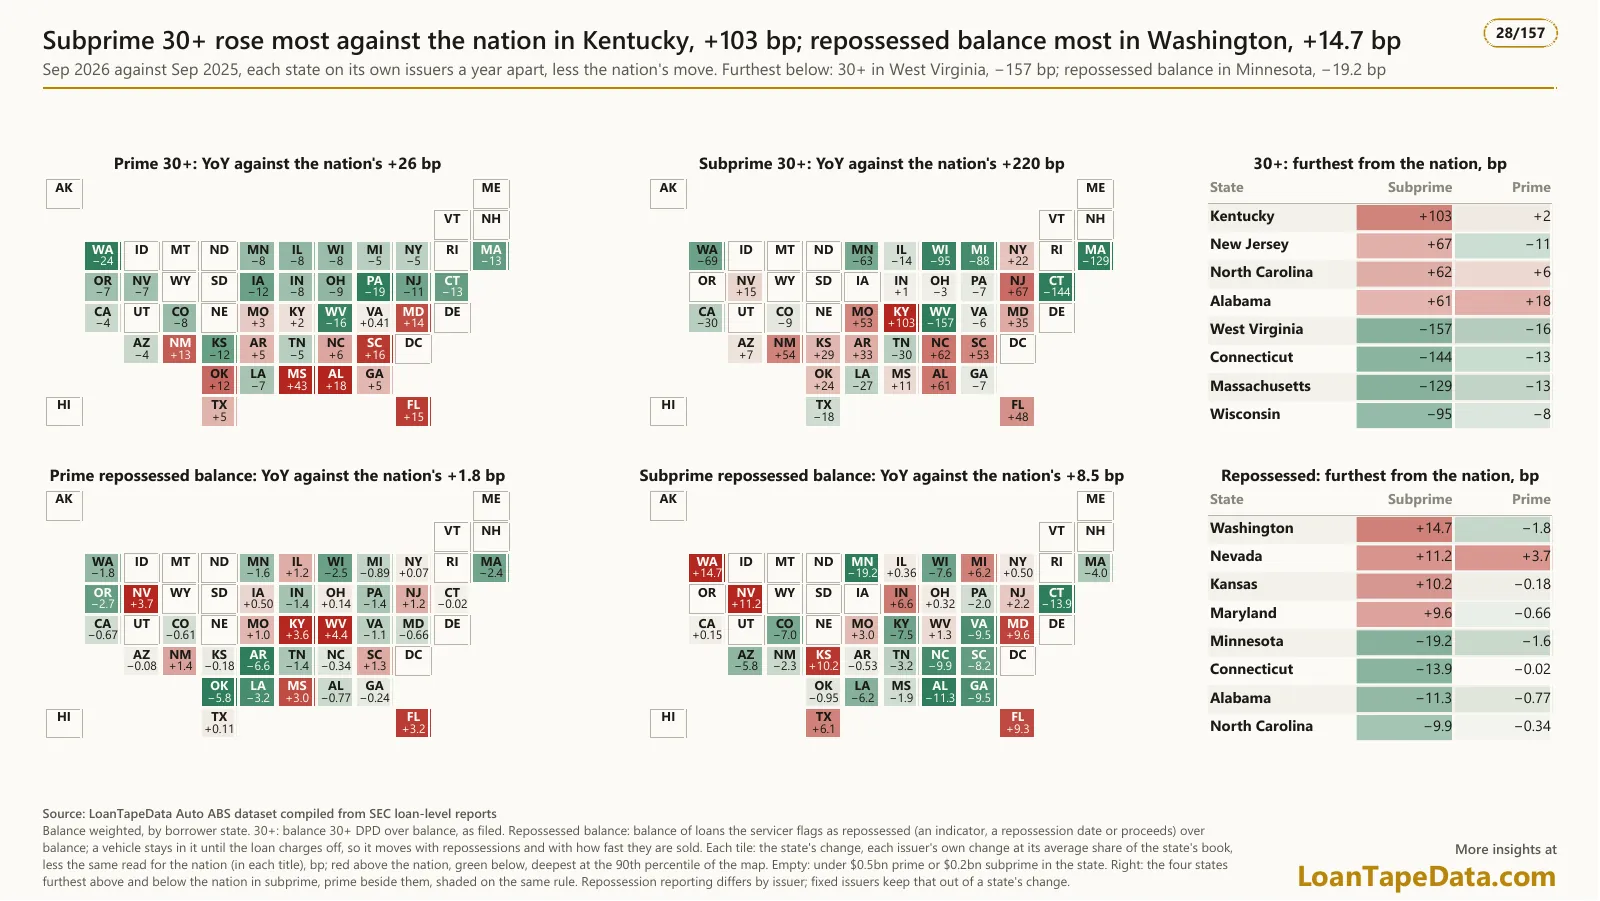
Subprime 30+ delinquency rose +220 bp nationally; in Kentucky it rose 103 bp more.
Fig. 5 Payment Extensions · p. 19/84
Most extended prime loans are back on track two months later
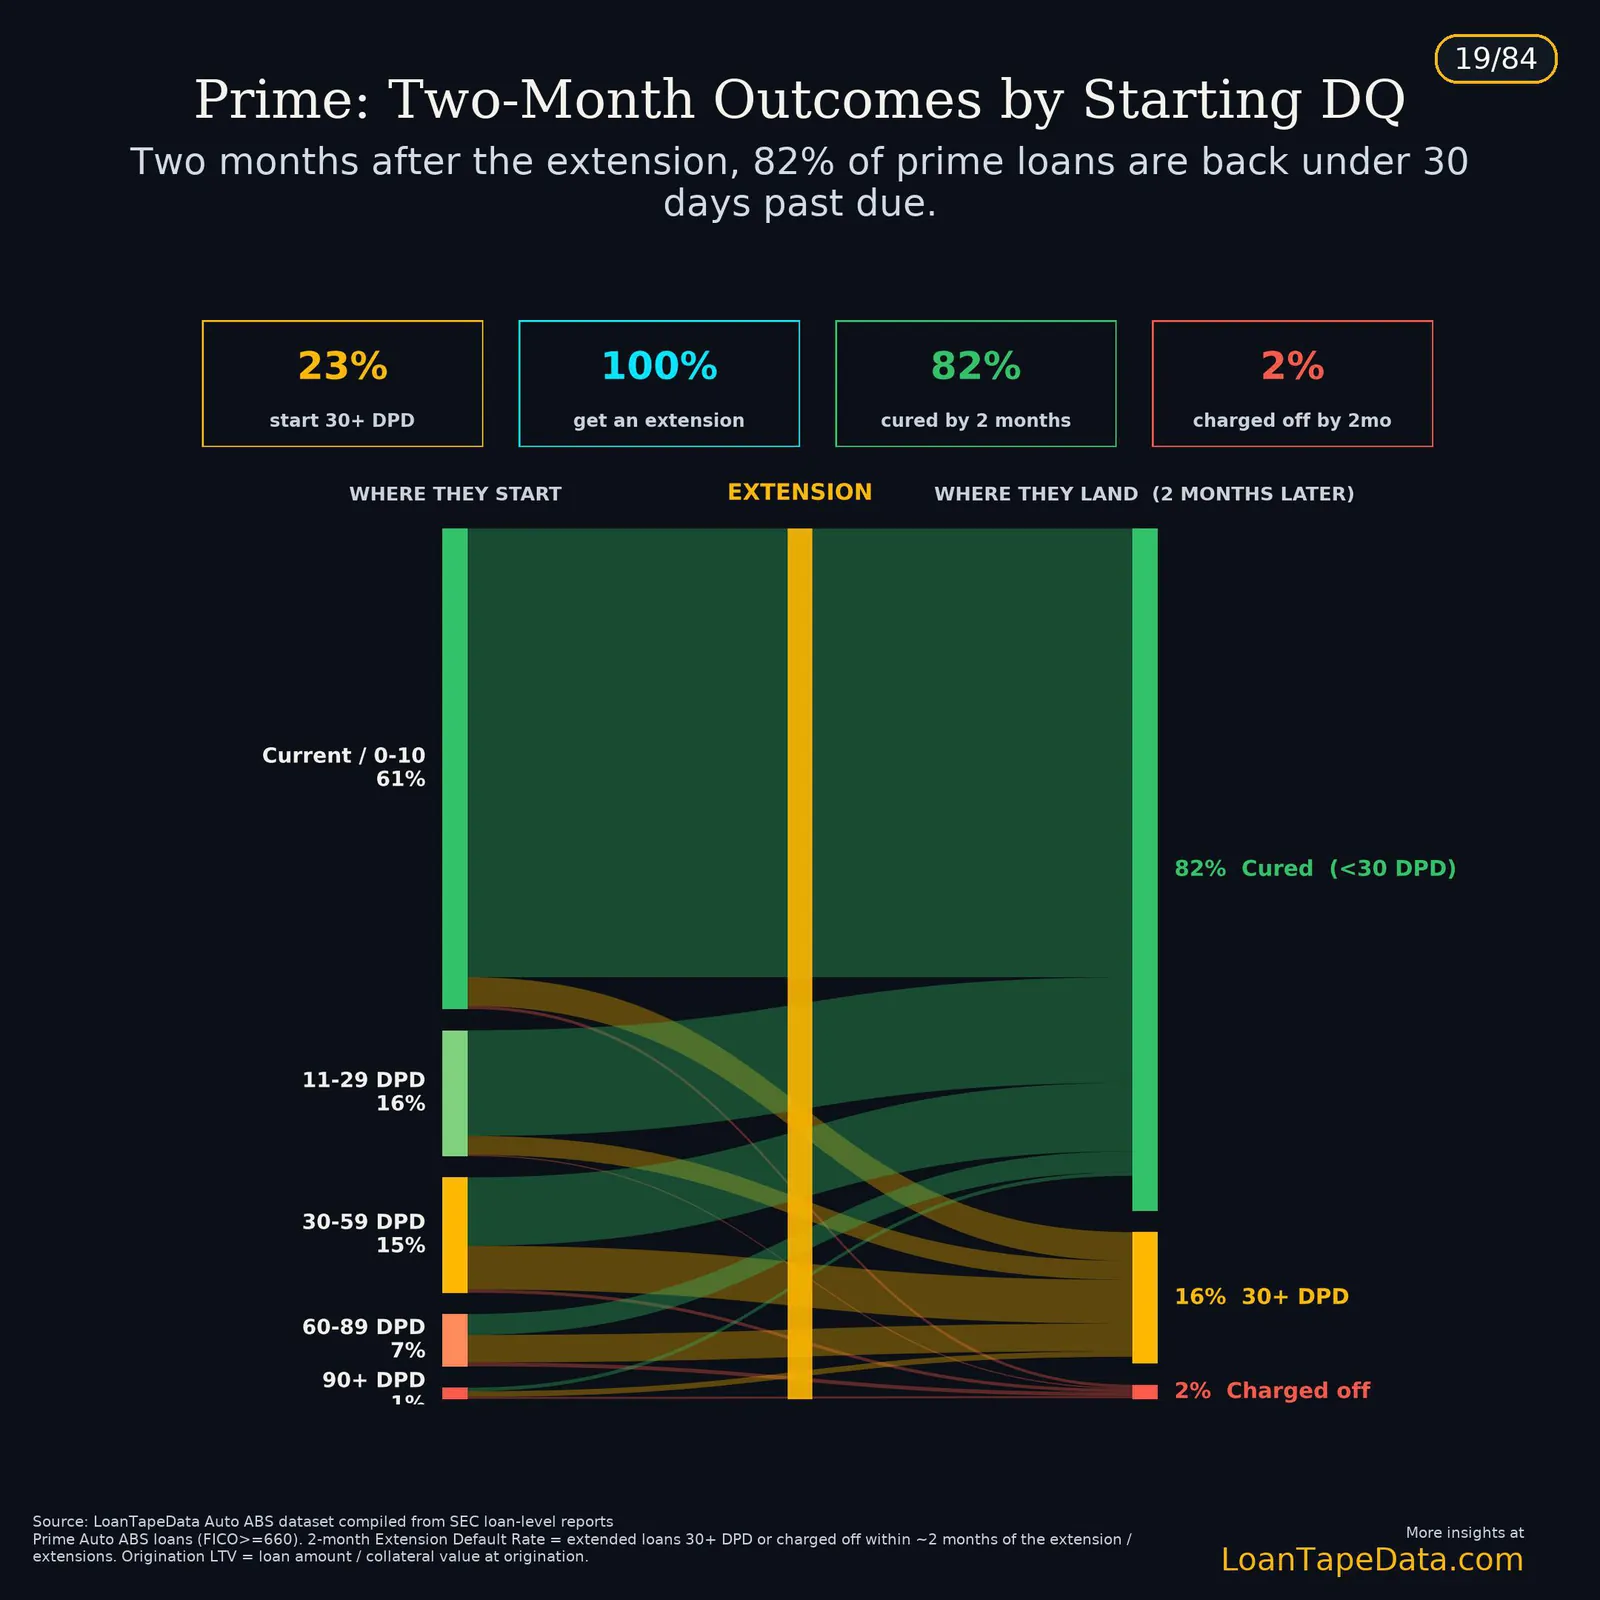
Two months after an extension, 82% of prime loans were under 30 days past due and 2% had charged off.
Fig. 6 Payment Extensions · p. 83/84
Subprime Extension Default Rates differ fivefold by issuer
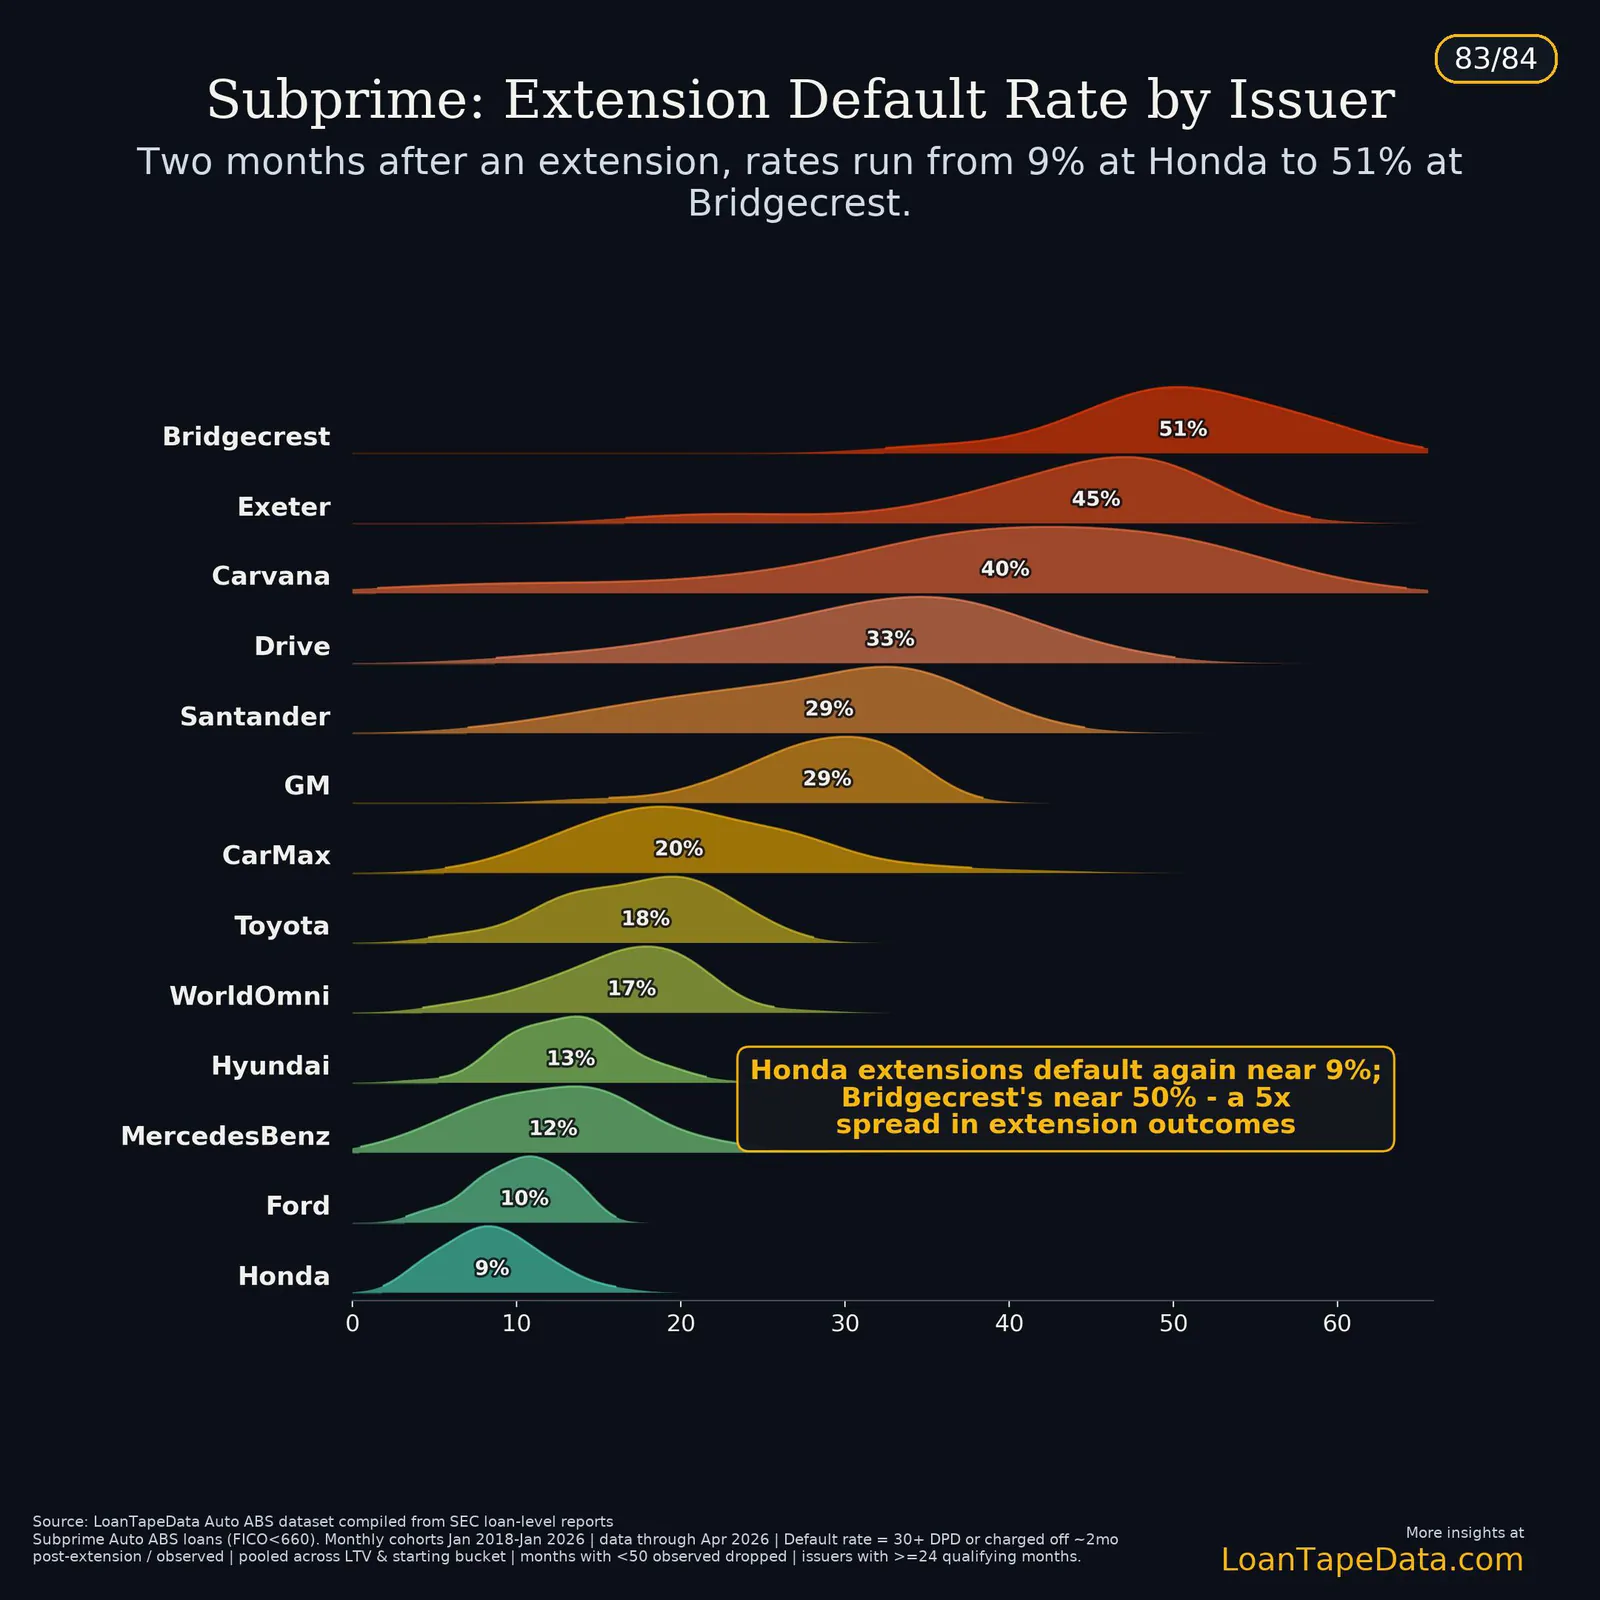
Two months after an extension, 51% of Bridgecrest's extended loans had defaulted, against 9% at Honda.
Fig. 7 Modification Effectiveness · p. 63/93
Six months after an extension, most prime borrowers are current
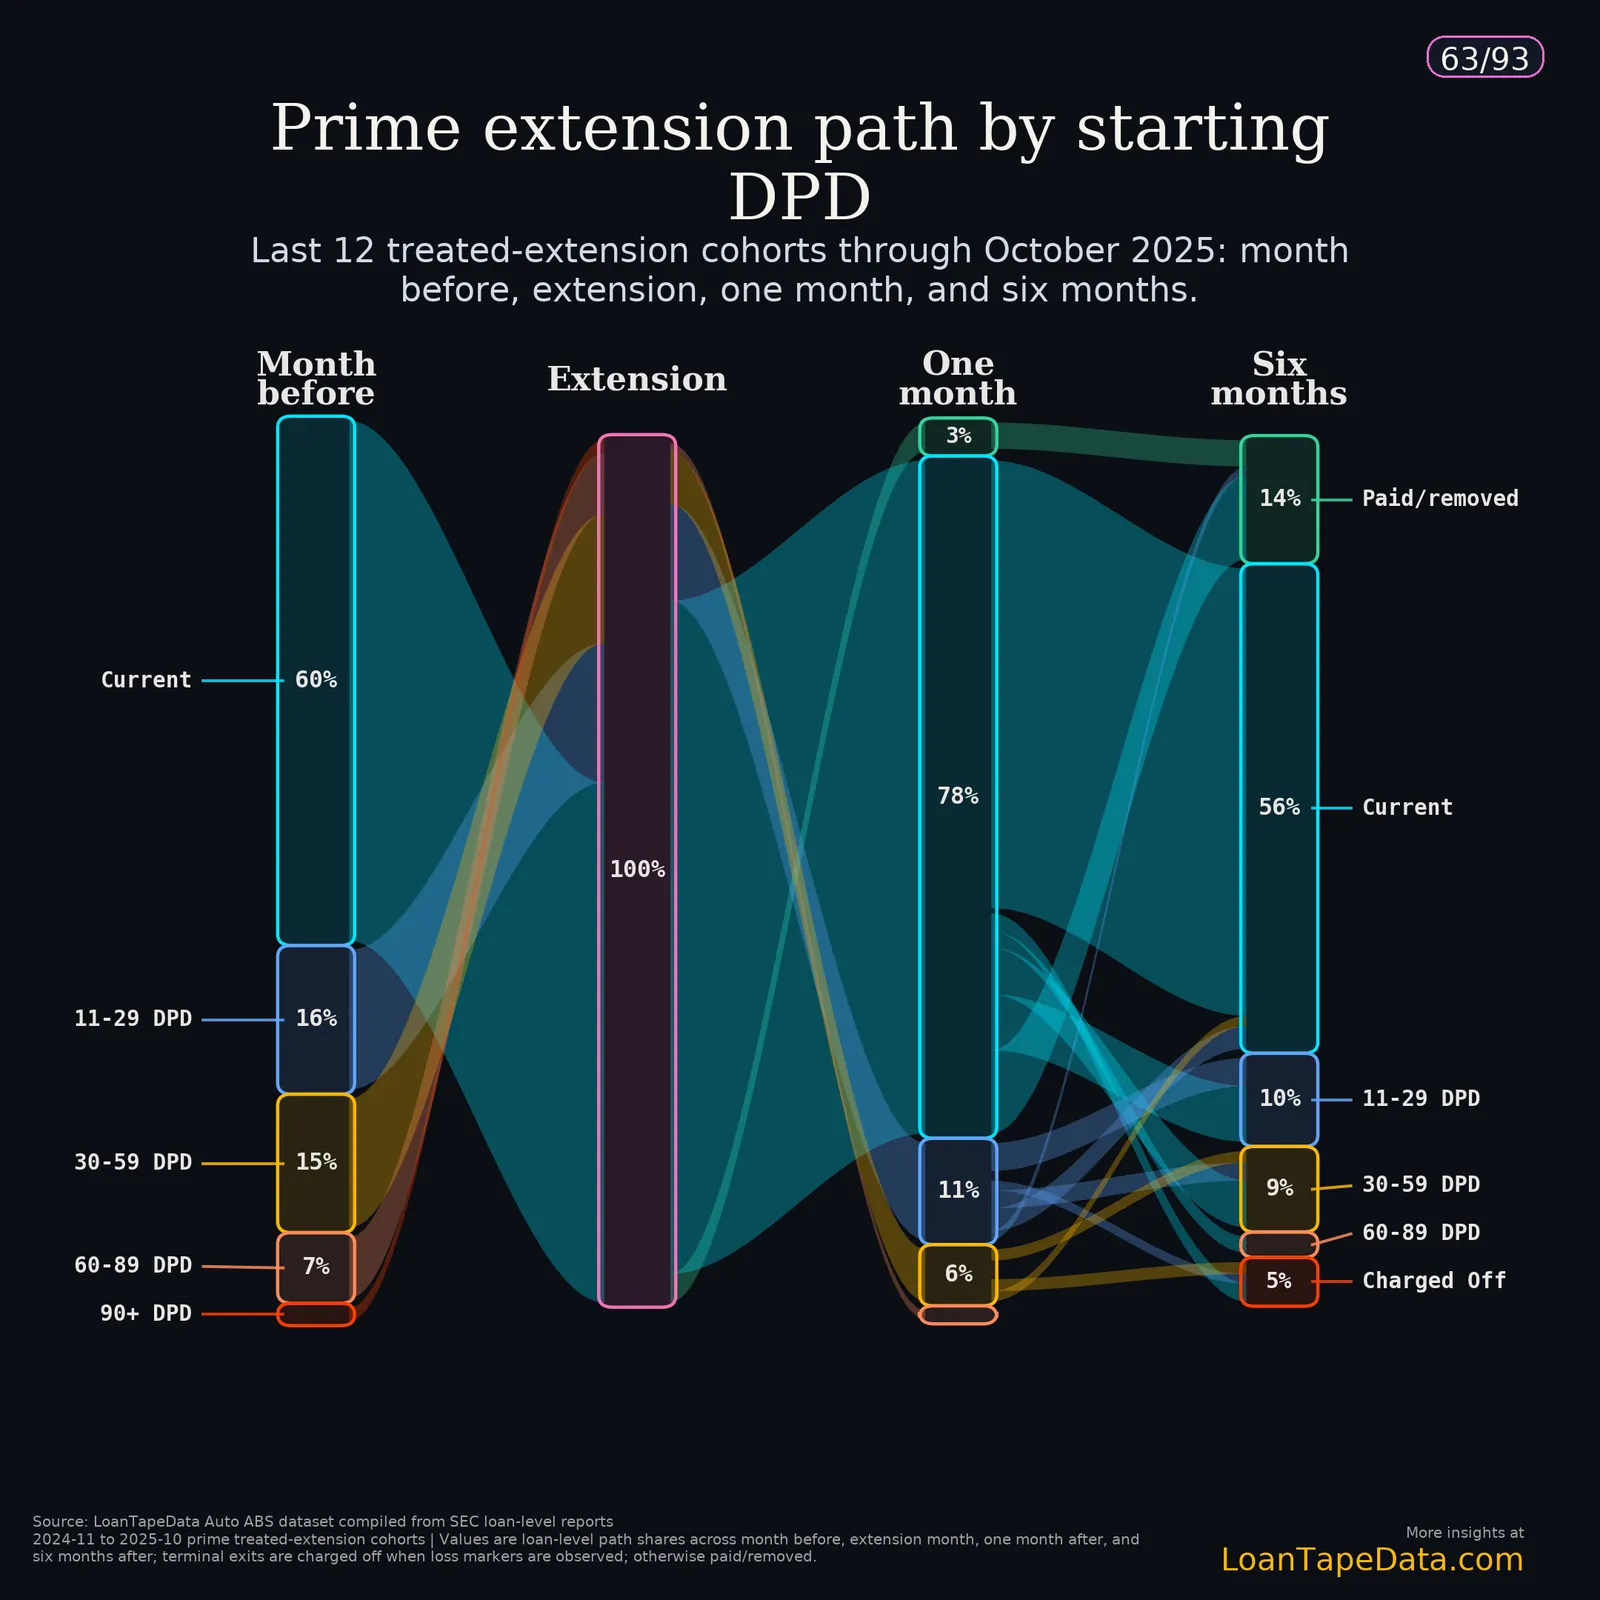
Six months on, 56% of extended prime loans were current and 5% had charged off.
Fig. 8 Vehicle Collateral and LTV · p. 14/41
Subprime collateral is two years older than prime
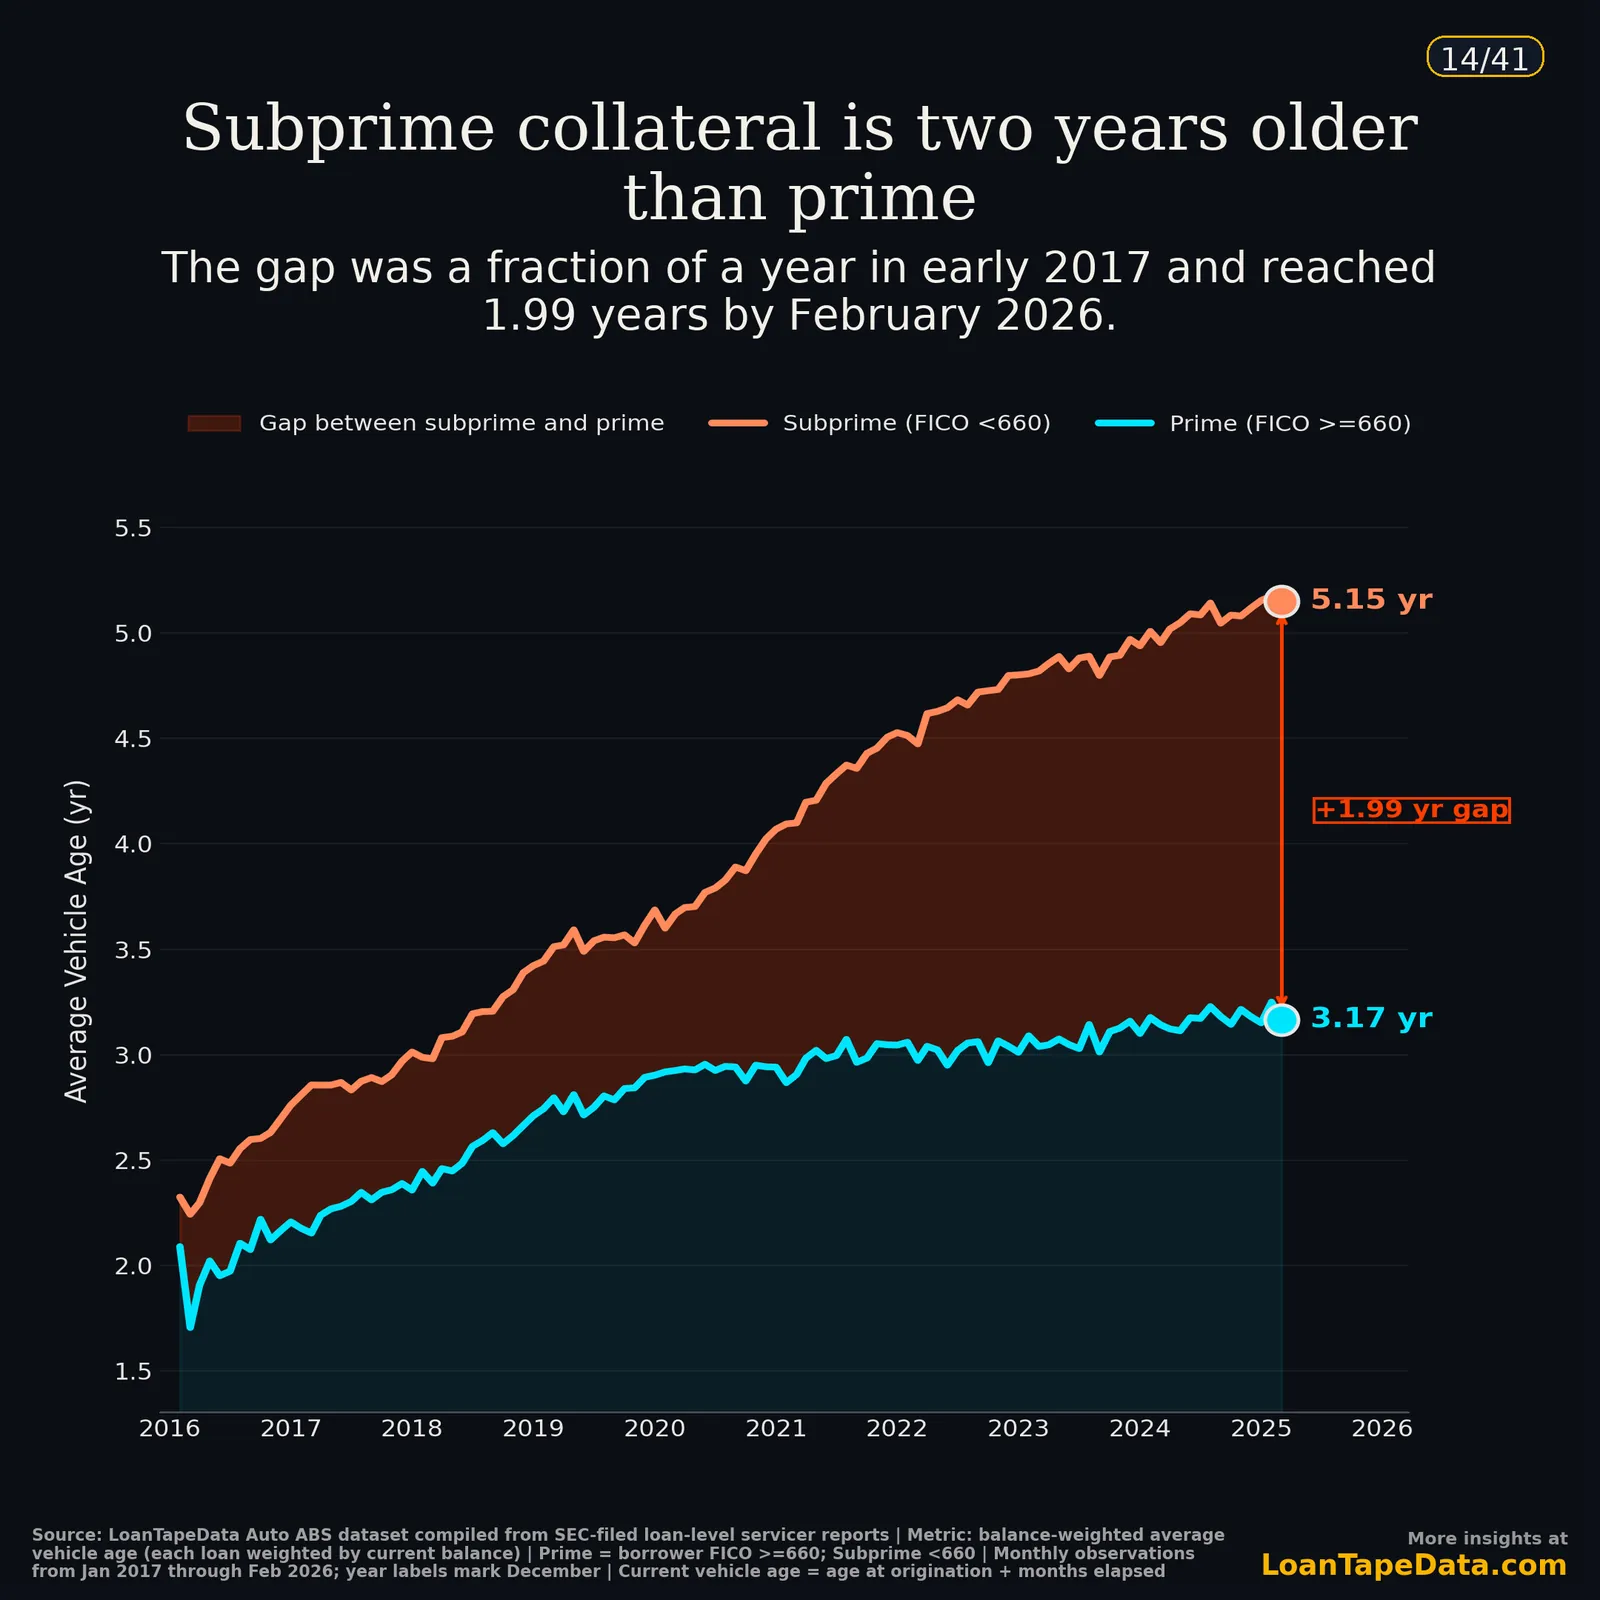
Subprime vehicles averaged 5.15 years old by February 2026, prime 3.17: a gap of 1.99 years.
Fig. 9 Vehicle Collateral and LTV · p. 5/41
Older vehicles add loss severity on top of high LTV
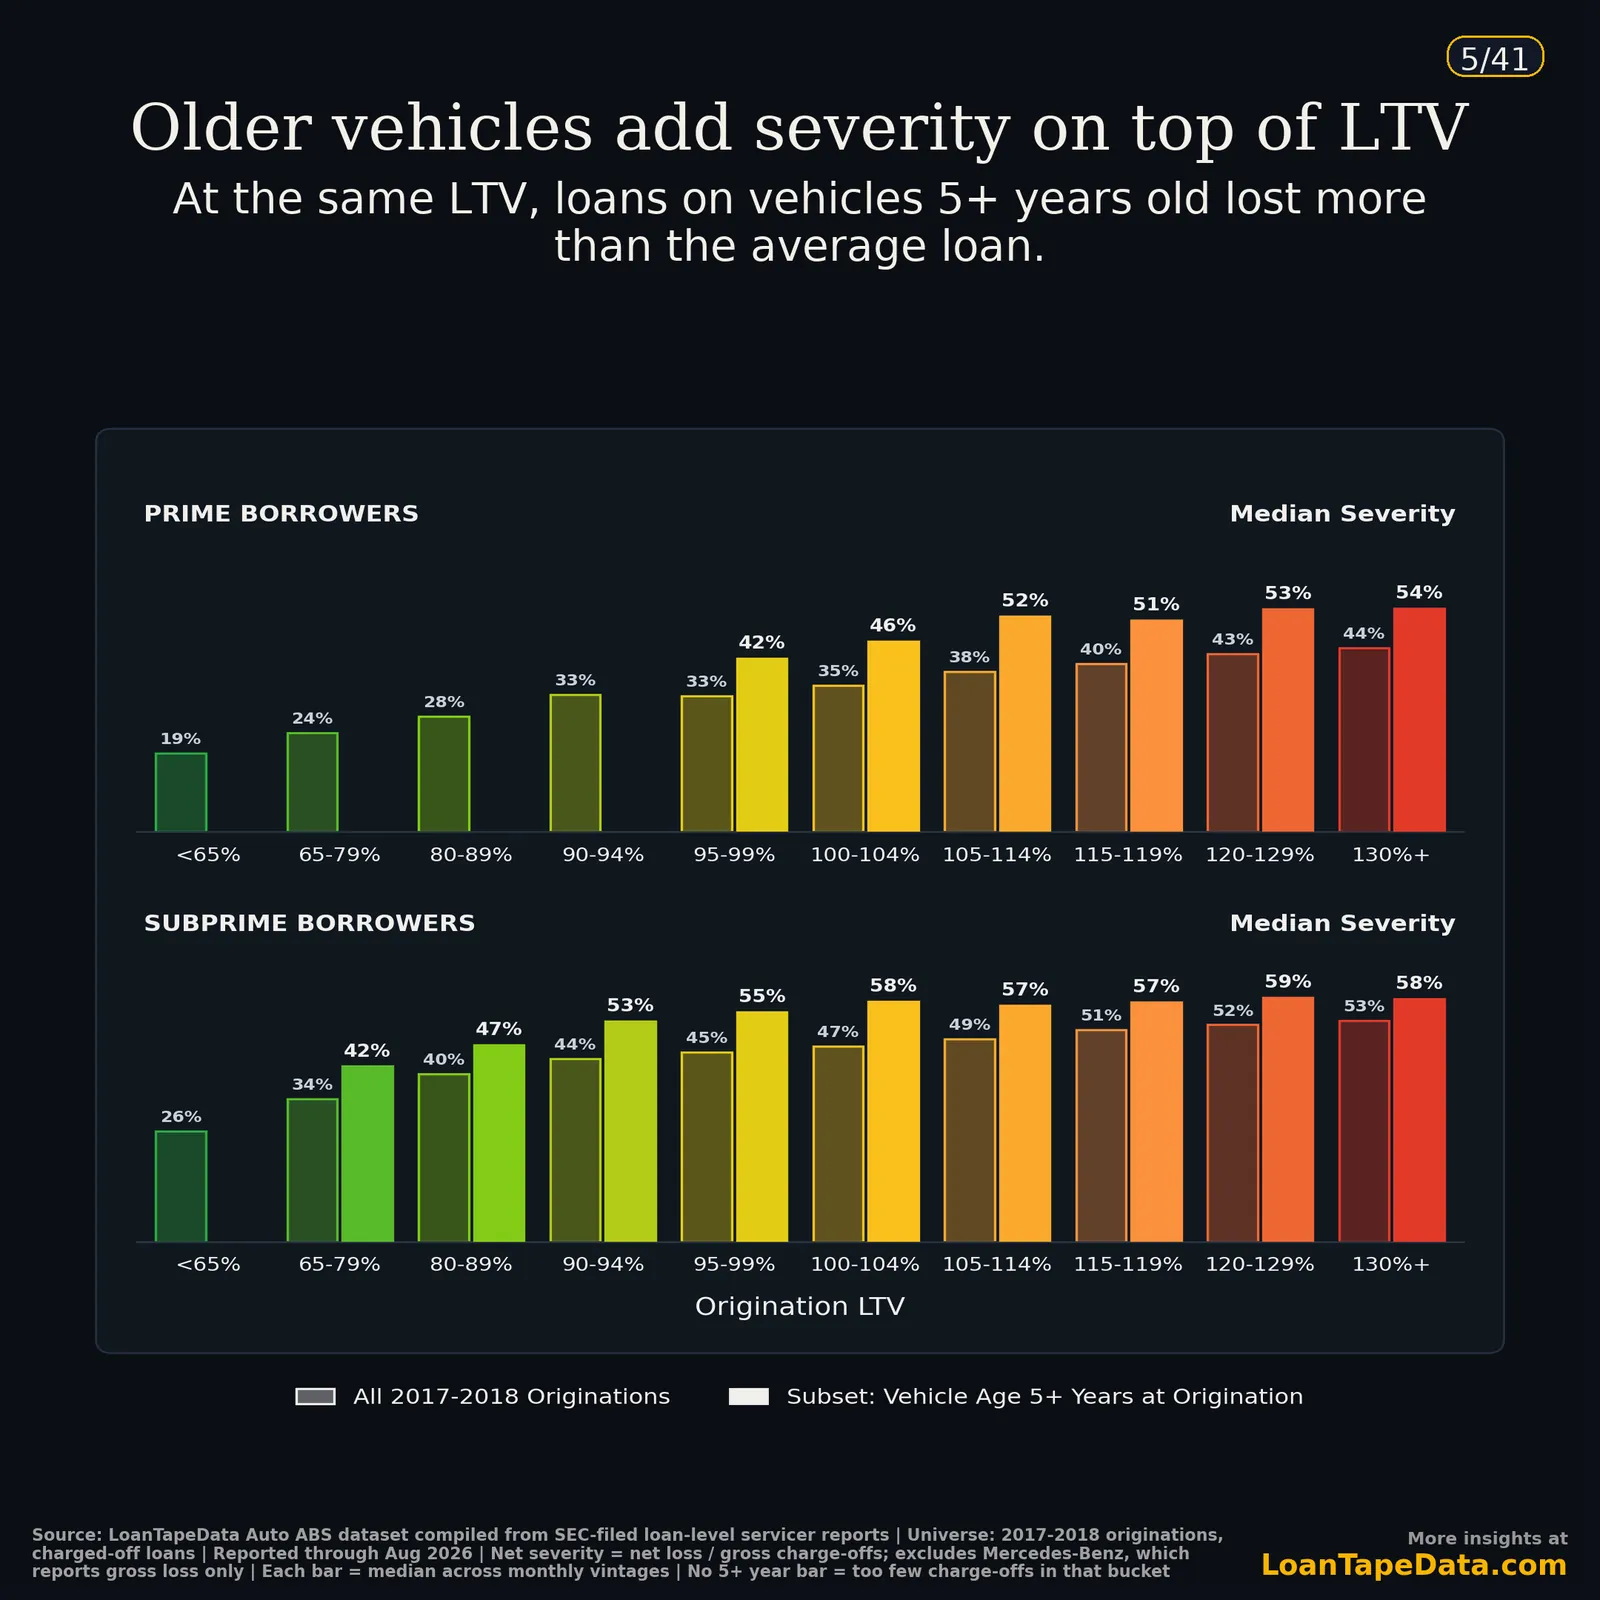
Above 130% LTV, prime loans on 5+ year-old vehicles lost a median 54%, against 44% for the band.
One Deck, Every Page: Auto Monitor, September 2026 · 157 Pages
The monthly Auto ABS deck for Premium and Enterprise. Page-by-page contents
 1Cover
 2The month
 3Contents
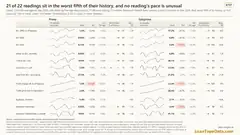 422 readings against their history
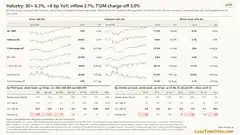 5Industry dashboard
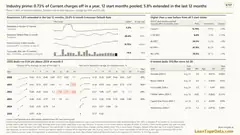 6Industry prime
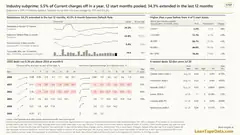 7Industry subprime
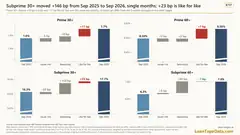 8What moved 30+: mix, age, like for like
 9How to read this deck
 10Trust adds
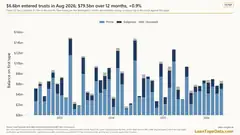 11Balance entering trusts by month
 12New trusts against their issuer's book
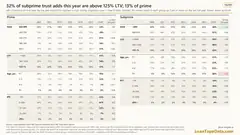 13Trust adds by FICO, LTV, age and PTI
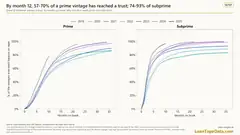 14How much of a vintage is on tape
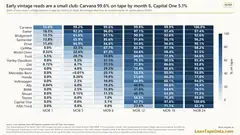 15Vintage on tape by issuer
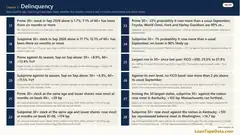 16Delinquency
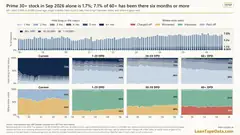 17Prime stock and time in bucket
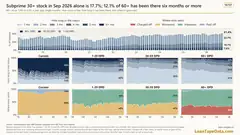 18Subprime stock and time in bucket
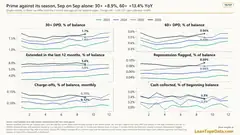 19Prime against its season
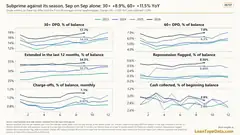 20Subprime against its season
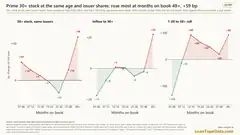 21Prime 30+ at the same age and issuer shares
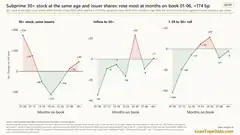 22Subprime 30+ at the same age and issuer shares
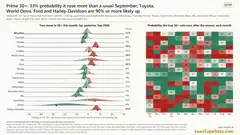 23Prime 30+ move against a usual September
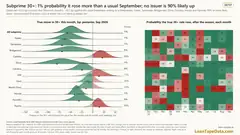 24Subprime 30+ move against a usual September
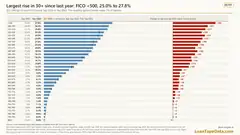 2530+ by FICO band, year on year
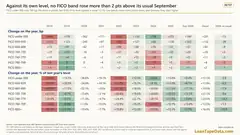 26FICO bands against a usual September
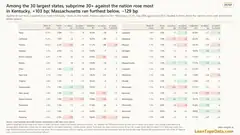 27Subprime 30+ by state
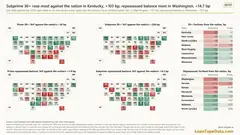 2830+ and repossessions by state, maps
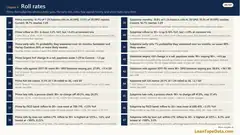 29Roll rates
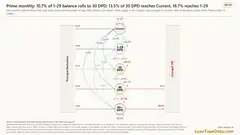 30Prime monthly balance flows
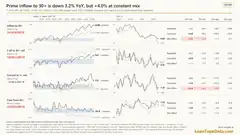 31Prime inflow to 30+ at constant mix
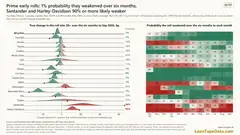 32Prime early rolls by issuer
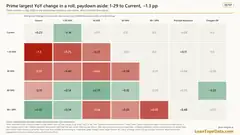 33Prime roll changes year on year
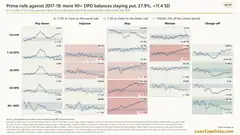 34Prime rolls against 2017-19
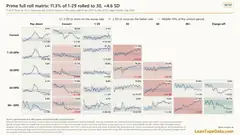 35Prime full roll matrix
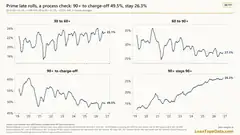 36Prime late rolls
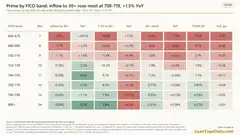 37Prime rolls by FICO band
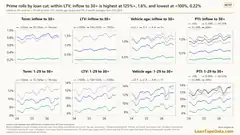 38Prime rolls by term and LTV
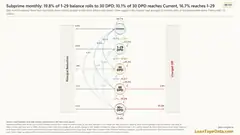 39Subprime monthly balance flows
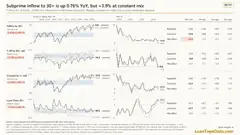 40Subprime inflow to 30+ at constant mix
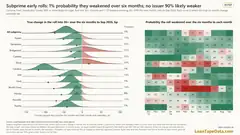 41Subprime early rolls by issuer
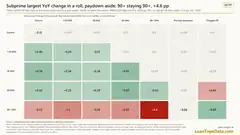 42Subprime roll changes year on year
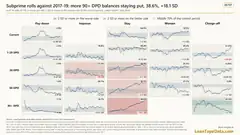 43Subprime rolls against 2017-19
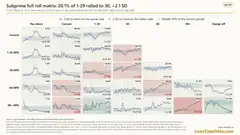 44Subprime full roll matrix
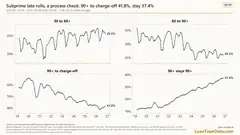 45Subprime late rolls
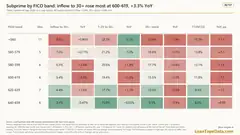 46Subprime rolls by FICO band
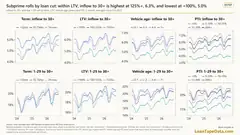 47Subprime rolls by term and LTV
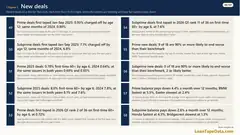 48New deals
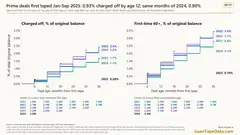 49Prime deal charge-offs by age
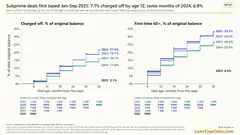 50Subprime deal charge-offs by age
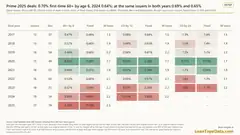 51Prime first-time 60+ at fixed issuer mix
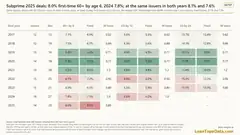 52Subprime first-time 60+ at fixed issuer mix
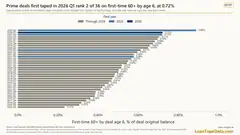 53Prime deal quarters ranked
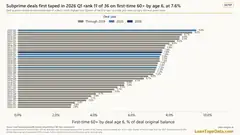 54Subprime deal quarters ranked
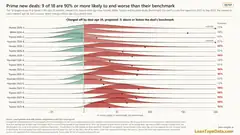 55Prime new deals against their benchmark
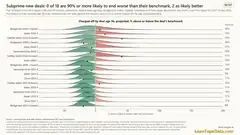 56Subprime new deals against their benchmark
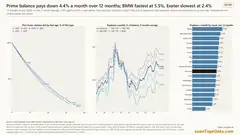 57Prime paydown by issuer
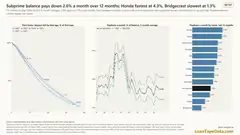 58Subprime paydown by issuer
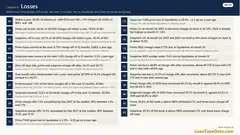 59Losses
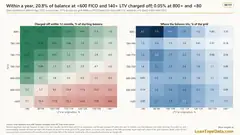 6012-month charge-off by FICO and LTV
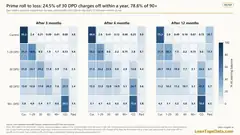 61Prime roll to loss
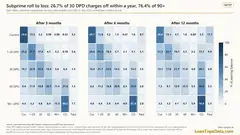 62Subprime roll to loss
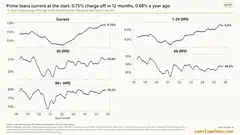 63Prime 12-month charge-off by starting state
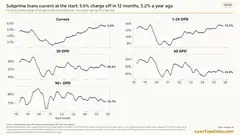 64Subprime 12-month charge-off by starting state
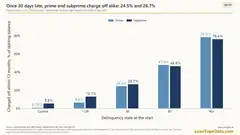 65Prime and subprime once 30 days late
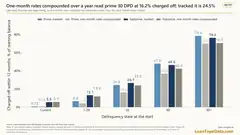 66One-month rates against tracked loss
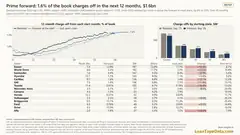 67Prime 12-month forward charge-off
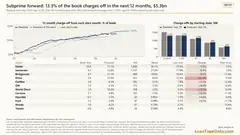 68Subprime 12-month forward charge-off
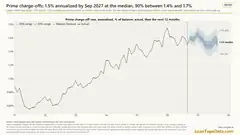 69Prime charge-off outlook
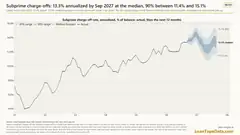 70Subprime charge-off outlook
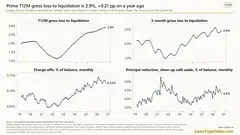 71Prime loss to liquidation by month
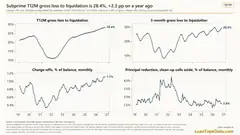 72Subprime loss to liquidation by month
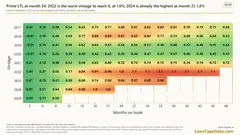 73Prime loss to liquidation by vintage
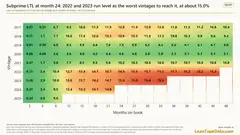 74Subprime loss to liquidation by vintage
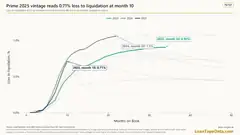 75Prime newest vintages, loss to liquidation
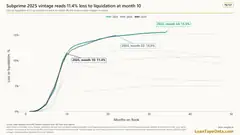 76Subprime newest vintages, loss to liquidation
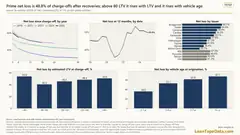 77Prime severity by LTV and vehicle age
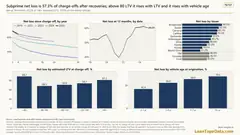 78Subprime severity by LTV and vehicle age
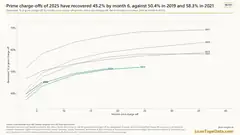 79Prime recoveries by year of charge-off
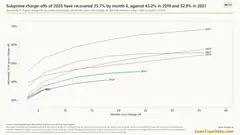 80Subprime recoveries by year of charge-off
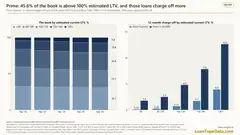 81Prime estimated current LTV
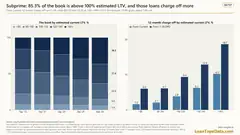 82Subprime estimated current LTV
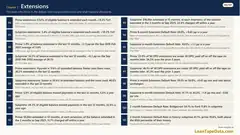 83Extensions
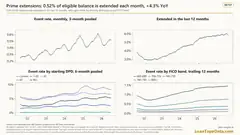 84Prime extension activity
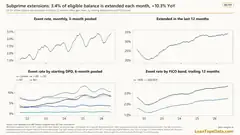 85Subprime extension activity
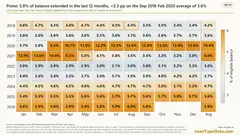 86Prime extensions against 2018-20
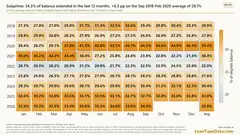 87Subprime extensions against 2018-20
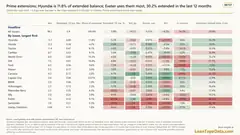 88Prime extensions by issuer
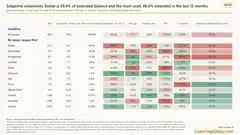 89Subprime extensions by issuer
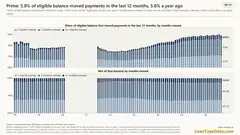 90Prime months moved
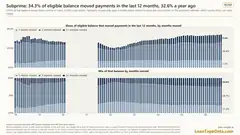 91Subprime months moved
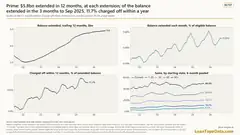 92Prime dollars extended
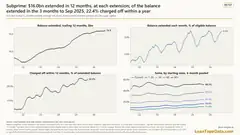 93Subprime dollars extended
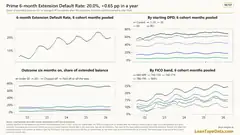 94Prime 6-month Extension Default Rate
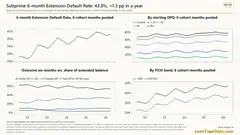 95Subprime 6-month Extension Default Rate
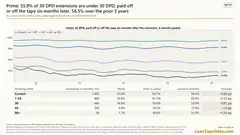 96Prime after a 30 DPD extension
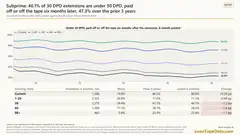 97Subprime after a 30 DPD extension
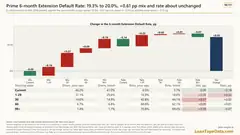 98Prime Extension Default Rate, mix and rate
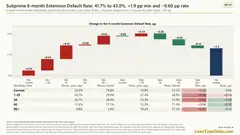 99Subprime Extension Default Rate, mix and rate
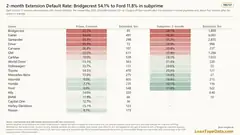 1002-month Extension Default Rate by issuer
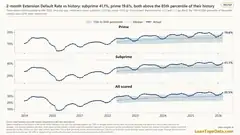 101Extension Default Rate against history
 102Issuers
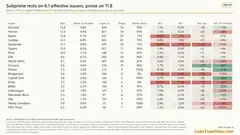 103Issuer concentration
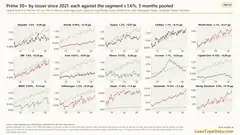 104Prime 30+ by issuer since 2021
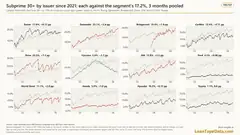 105Subprime 30+ by issuer since 2021
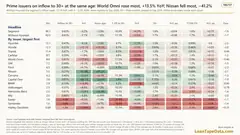 106Prime issuers, inflow to 30+ at the same age
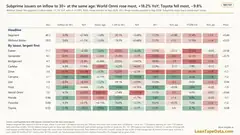 107Subprime issuers, inflow to 30+ at the same age
 108Prime issuer league table
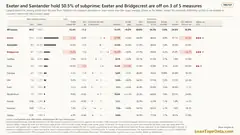 109Subprime issuer league table
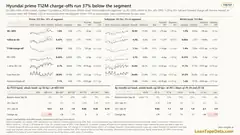 110Hyundai, top level
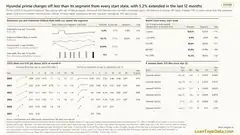 111Hyundai prime, under the surface
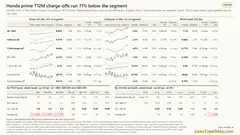 112Honda, top level
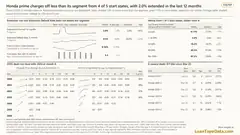 113Honda prime, under the surface
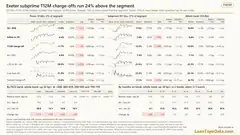 114Exeter, top level
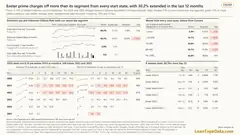 115Exeter prime, under the surface
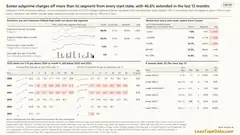 116Exeter subprime, under the surface
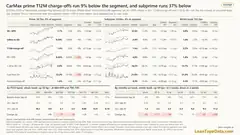 117CarMax, top level
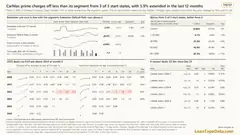 118CarMax prime, under the surface
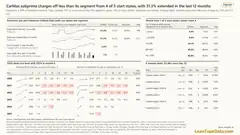 119CarMax subprime, under the surface
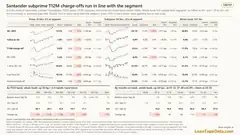 120Santander, top level
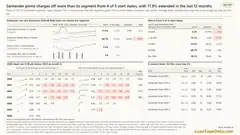 121Santander prime, under the surface
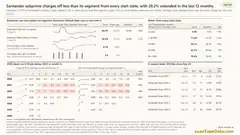 122Santander subprime, under the surface
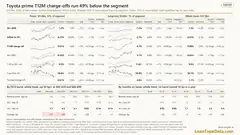 123Toyota, top level
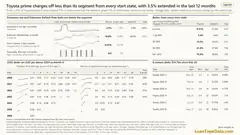 124Toyota prime, under the surface
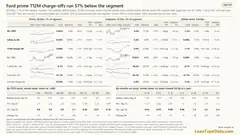 125Ford, top level
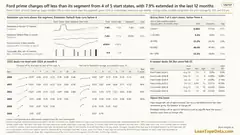 126Ford prime, under the surface
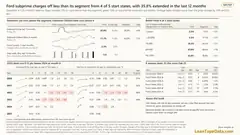 127Ford subprime, under the surface
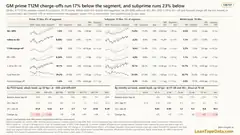 128GM, top level
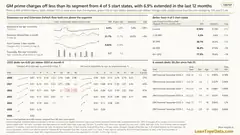 129GM prime, under the surface
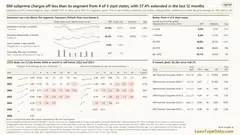 130GM subprime, under the surface
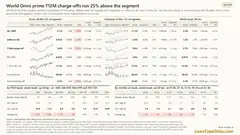 131World Omni, top level
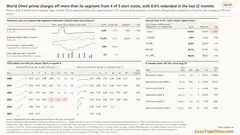 132World Omni prime, under the surface
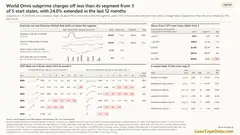 133World Omni subprime, under the surface
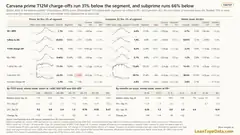 134Carvana, top level
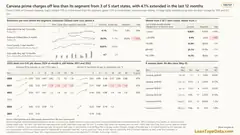 135Carvana prime, under the surface
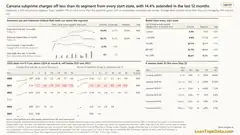 136Carvana subprime, under the surface
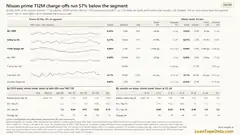 137Nissan, top level
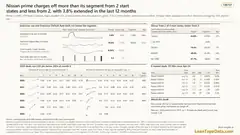 138Nissan prime, under the surface
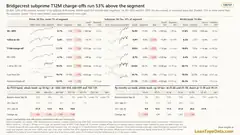 139Bridgecrest, top level
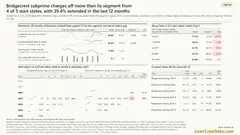 140Bridgecrest subprime, under the surface
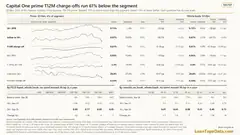 141Capital One, top level
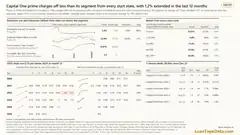 142Capital One prime, under the surface
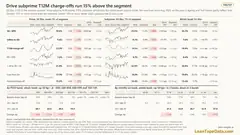 143Drive, top level
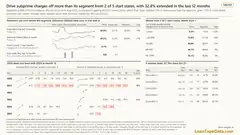 144Drive subprime, under the surface
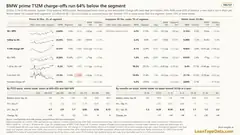 145BMW, top level
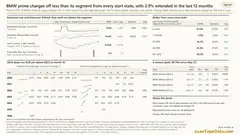 146BMW prime, under the surface
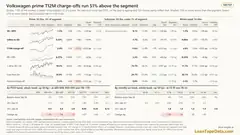 147Volkswagen, top level
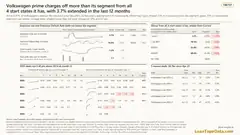 148Volkswagen prime, under the surface
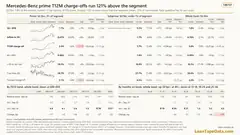 149Mercedes-Benz, top level
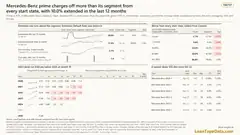 150Mercedes-Benz prime, under the surface
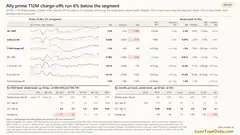 151Ally, top level
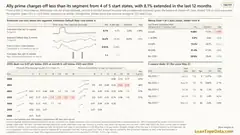 152Ally prime, under the surface
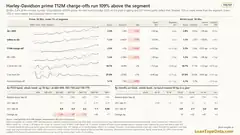 153Harley-Davidson, top level
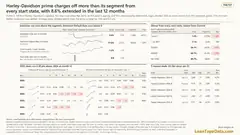 154Harley-Davidson prime, under the surface
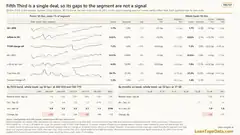 155Fifth Third, top level
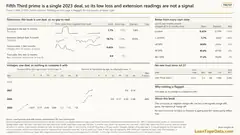 156Fifth Third prime, under the surface
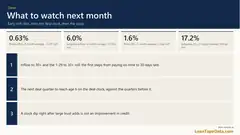 157What to watch next month
Before you subscribe
The questions subscribers most often ask about access and plans.
How do the dashboard access links work?
After you subscribe, Stripe sends you back to LoanTape and your browser is signed in automatically.
If you are on a different device or the browser session expires, request a fresh link at /access or /resend with the same subscriber email. We only send a new link when that address has an active subscription.
When do I receive access after subscribing?
Access starts as soon as Stripe confirms the subscription. If the redirect is interrupted, use /access with the billing email from checkout, or email [email protected].
What is the difference between Dashboard Access and Premium Analytics?
Dashboard Access is the monthly market dashboard, updated with each data release. Premium adds live issuer drill-downs, CSV exports and the AI analyst. Enterprise adds dedicated analyst time for custom work.
What if I need multiple users or a custom workflow?
Each standard plan has one subscriber login email. For team access or recurring custom analysis, contact [email protected] about Enterprise.
How pricing works
Querying billions of loan-level records costs money in cloud compute. Each plan’s price follows what it costs to run.
Dashboard Access
Pre-computed monthly snapshots
We run the heavy queries once each month and cache the results as compact data cubes. Your dashboard reads those snapshots without running a query, and every subscriber shares them, so adding a subscriber costs close to nothing.
$99a month
Premium Analytics
Live queries against the full dataset
Per-issuer drill-downs and CSV exports run live queries against the complete loan-level warehouse. AI Data Explorer drafts a chart from your question and lets you change its metric and filters by hand. The price covers the compute those live queries use.
$299a month
Enterprise
Human analyst time
Everything in Premium, plus 4 hours a month with an analyst who knows the data and the market, for custom research, benchmarking against the market or SBA and auto ABS comparisons, on your schedule. Most of the price is that person’s time.
$999a month