Auto ABS Delinquency Trends: January 2026
CarMax's portfolio-wide 30+ day delinquency rate dropped to 0.56% in January 2026, down from 0.73% a year earlier. Santander's held nearly flat at 3.85%, compared to 3.86% in January 2025. The gap between prime and subprime performance is widening at the 60+ day threshold, where Santander's rate rose 9 basis points year-over-year while CarMax's fell.
We parsed every ABS-EE filing through January 2026 for both issuers. Between them, that is 10.3 million loans and over $280 billion in original balance. Here is what the loan-level data shows.
Year-over-year: prime improving, subprime 60+ climbing
January 2026 marks a clear split. CarMax improved at both the 30+ and 60+ day thresholds. Santander's 30+ rate barely moved, and its 60+ rate got worse.
| Metric | CarMax Jan 2025 | CarMax Jan 2026 | Change | Santander Jan 2025 | Santander Jan 2026 | Change |
|---|---|---|---|---|---|---|
| DQ 30+ | 0.73% | 0.56% | -0.17pp | 3.86% | 3.85% | -0.01pp |
| DQ 60+ | 0.26% | 0.22% | -0.04pp | 1.44% | 1.53% | +0.09pp |
| Loans | 2,832,369 | 2,937,483 | +105K | 6,966,530 | 7,331,157 | +365K |
The Santander numbers tell a specific story. Fewer loans are entering early delinquency (30+ barely changed), but the loans that do go delinquent are rolling deeper. A 9 basis point increase in the 60+ rate while the 30+ rate stays flat means cure rates out of the 30-59 day bucket are deteriorating. Borrowers who fall behind are having a harder time catching up.
CarMax is the opposite. Both thresholds improved, which means fewer loans entering delinquency and the ones that do are curing at a higher rate.
FICO at origination is the strongest predictor
Stratifying by the borrower's FICO score at origination produces the cleanest view of where delinquency risk sits. The gradient is steep and consistent across both issuers.
CarMax — January 2026 by FICO bucket:
| FICO | Loans | DQ 30+ | DQ 60+ | Cumulative loss rate |
|---|---|---|---|---|
| Below 550 | 37,748 | 2.05% | 0.93% | 14.27% |
| 550-599 | 181,936 | 1.76% | 0.78% | 12.74% |
| 600-649 | 431,182 | 1.04% | 0.43% | 8.49% |
| 650-699 | 626,811 | 0.86% | 0.32% | 3.82% |
| 700-749 | 575,777 | 0.33% | 0.12% | 1.59% |
| 750+ | 1,056,077 | 0.06% | 0.02% | 0.40% |
Santander — January 2026 by FICO bucket:
| FICO | Loans | DQ 30+ | DQ 60+ | Cumulative loss rate |
|---|---|---|---|---|
| Below 550 | 1,382,339 | 5.59% | 2.17% | 23.73% |
| 550-599 | 2,090,381 | 4.26% | 1.66% | 20.28% |
| 600-649 | 1,802,770 | 3.87% | 1.53% | 16.79% |
| 650-699 | 629,297 | 2.87% | 1.18% | 13.81% |
| 700-749 | 257,234 | 2.15% | 0.87% | 10.58% |
| 750+ | 187,482 | 1.26% | 0.46% | 4.90% |
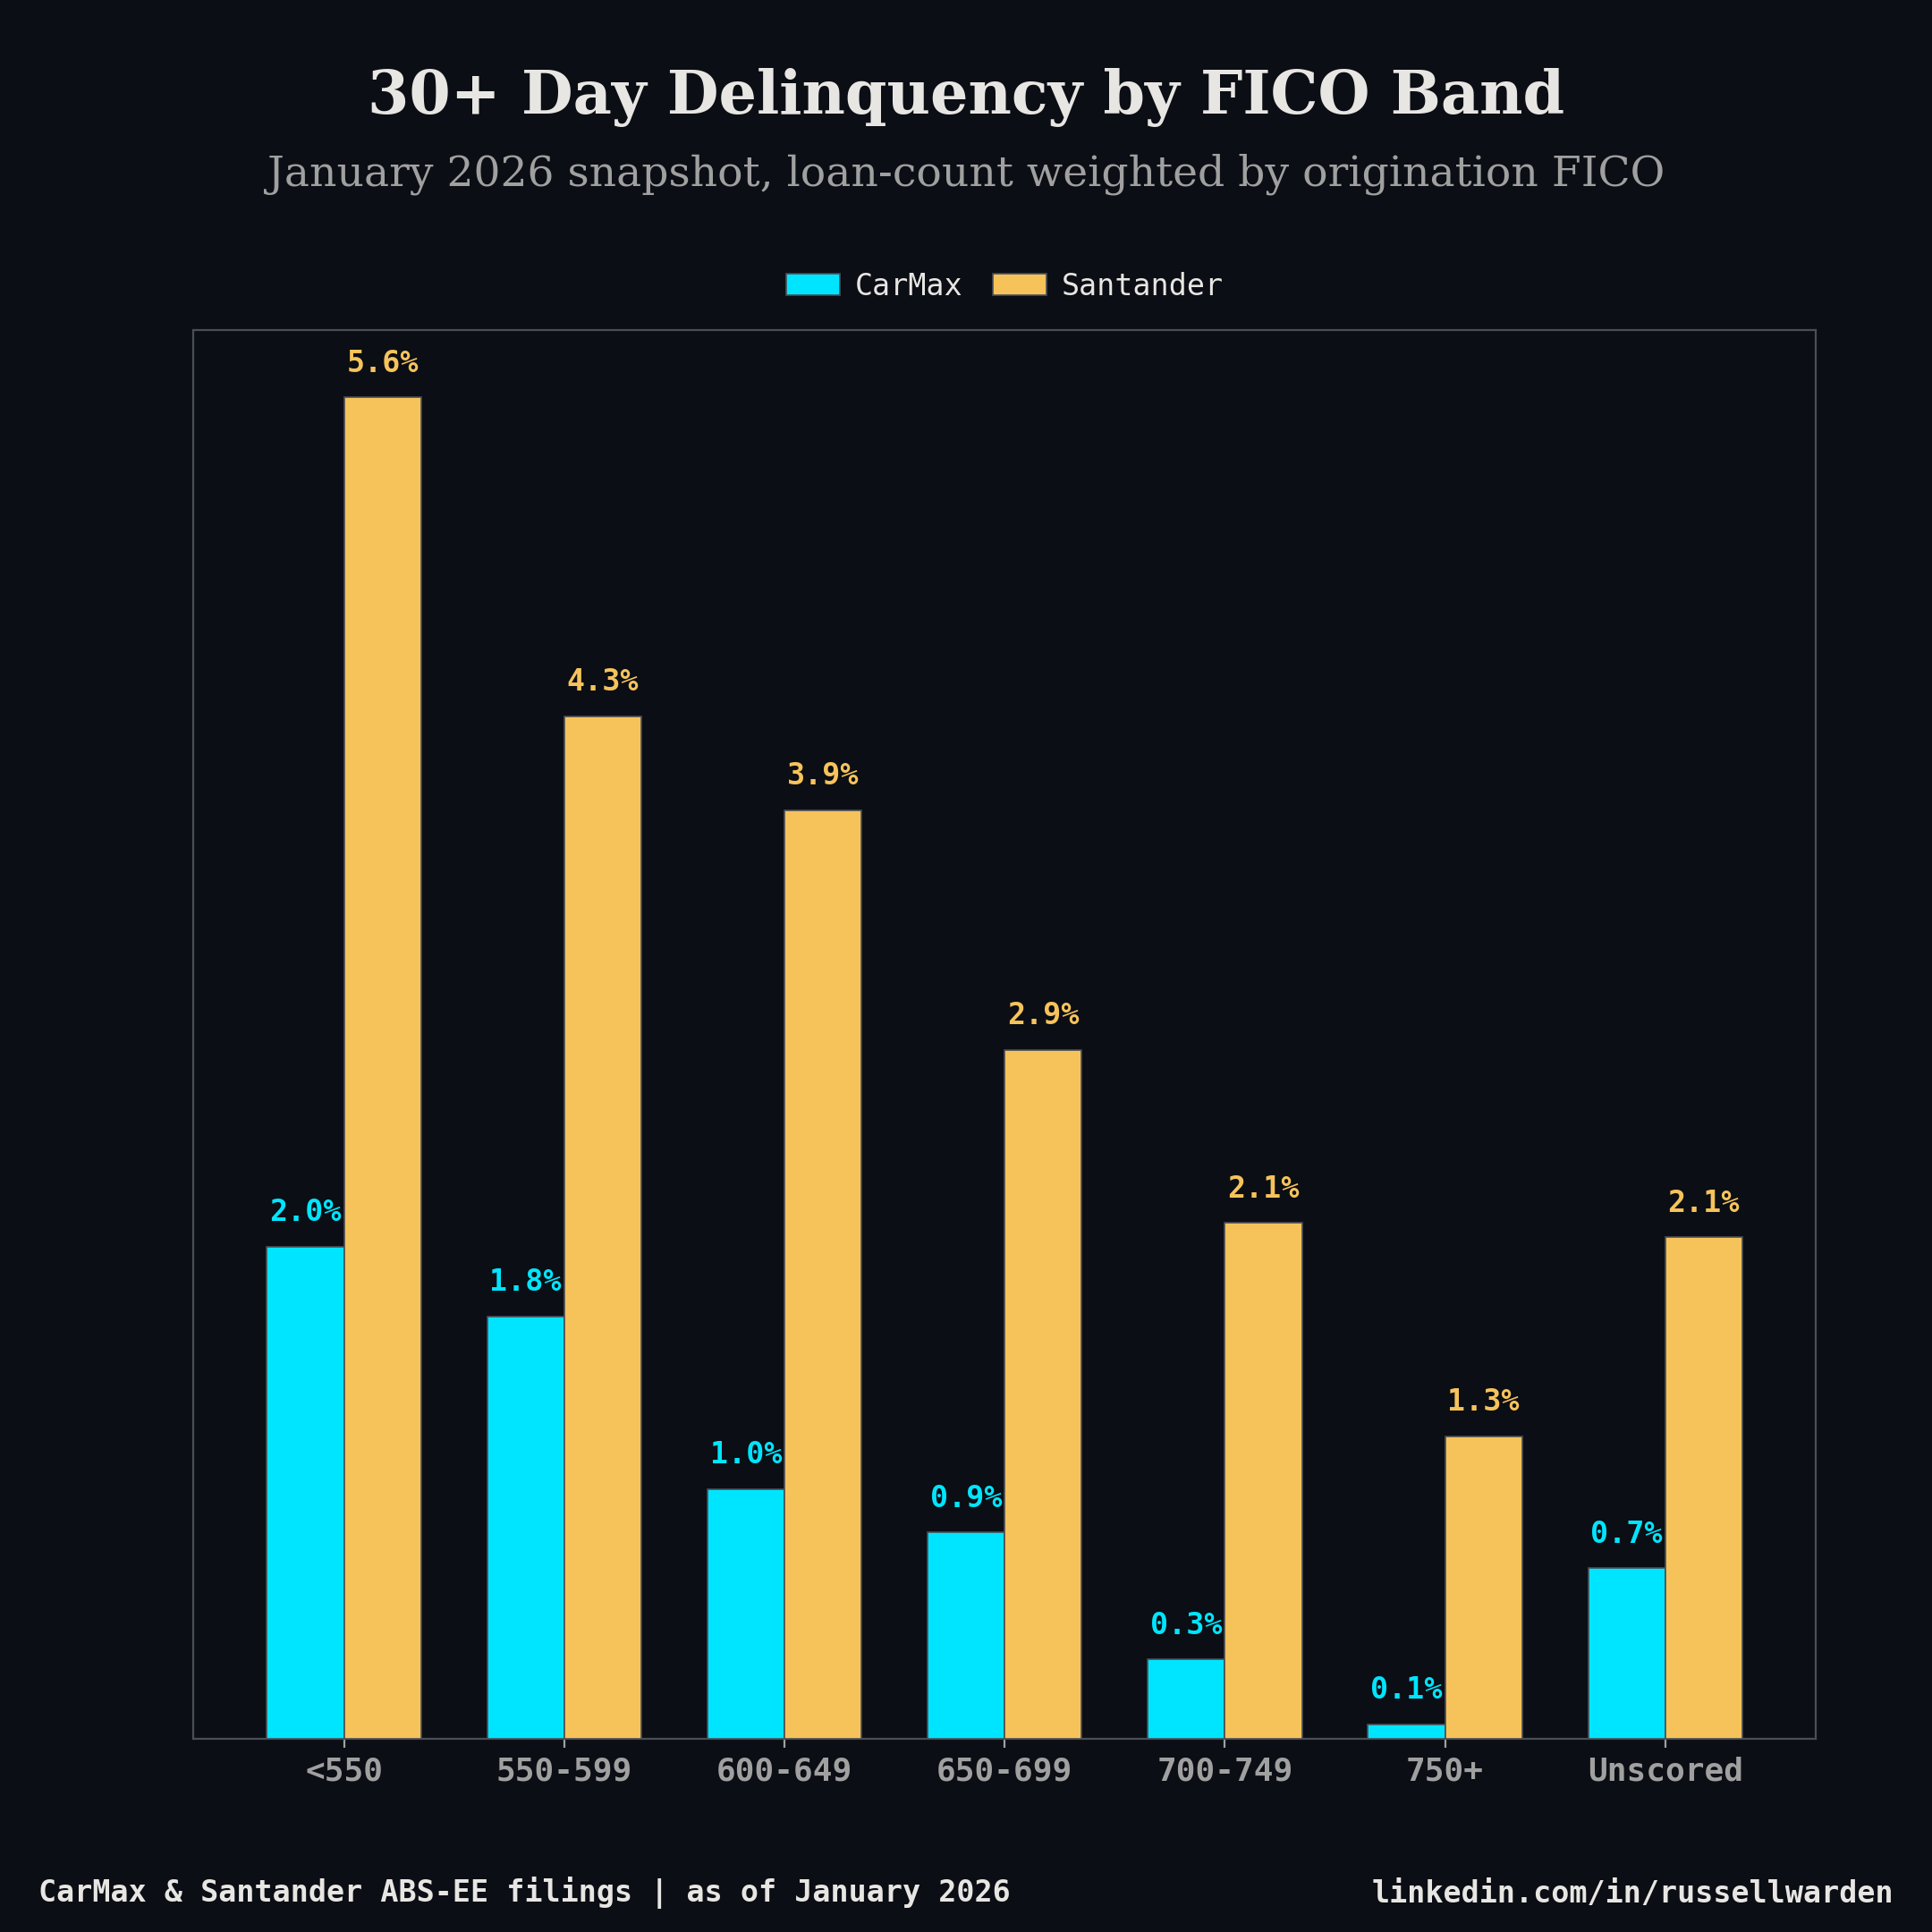
A few things stand out. Santander's sub-550 cohort is running at 5.59% DQ30+, nearly three times CarMax's rate for the same FICO band. Same credit score range, different underwriting, different outcomes. The cumulative loss frequency gap is even wider: 23.73% at Santander versus 14.27% at CarMax. Roughly one in four of Santander's sub-550 loans has charged off over the life of the portfolio.
The composition also matters. CarMax's pool is 56% FICO 700+ borrowers. Only 1.3% of CarMax's book is below 550. Santander's pool is 75% below 650, with 19% below 550. The portfolio-level DQ rates are a direct function of this mix.
For anyone running credit models on auto ABS trusts, the FICO-stratified view is more informative than the headline number. Two trusts with identical portfolio DQ rates can have very different risk profiles depending on how concentrated they are in the lower bands.
Vintage stress: the 2024 cohort is diverging
The most useful comparison in auto ABS is not across issuers — it is across origination vintages at the same loan age. A 2024 vintage at month 12 tells you something different than a 2022 vintage at month 24, because the economic environment and underwriting standards were different at origination. Comparing them at the same months-on-book controls for seasoning and isolates origination quality.
DQ 30+ at month-on-book 12 — January cohorts:
| Vintage | CarMax DQ 30+ | Santander DQ 30+ |
|---|---|---|
| Jan 2022 | 1.36% | 9.28% |
| Jan 2023 | 2.29% | 1.55% |
| Jan 2024 | 1.53% | 10.12% |
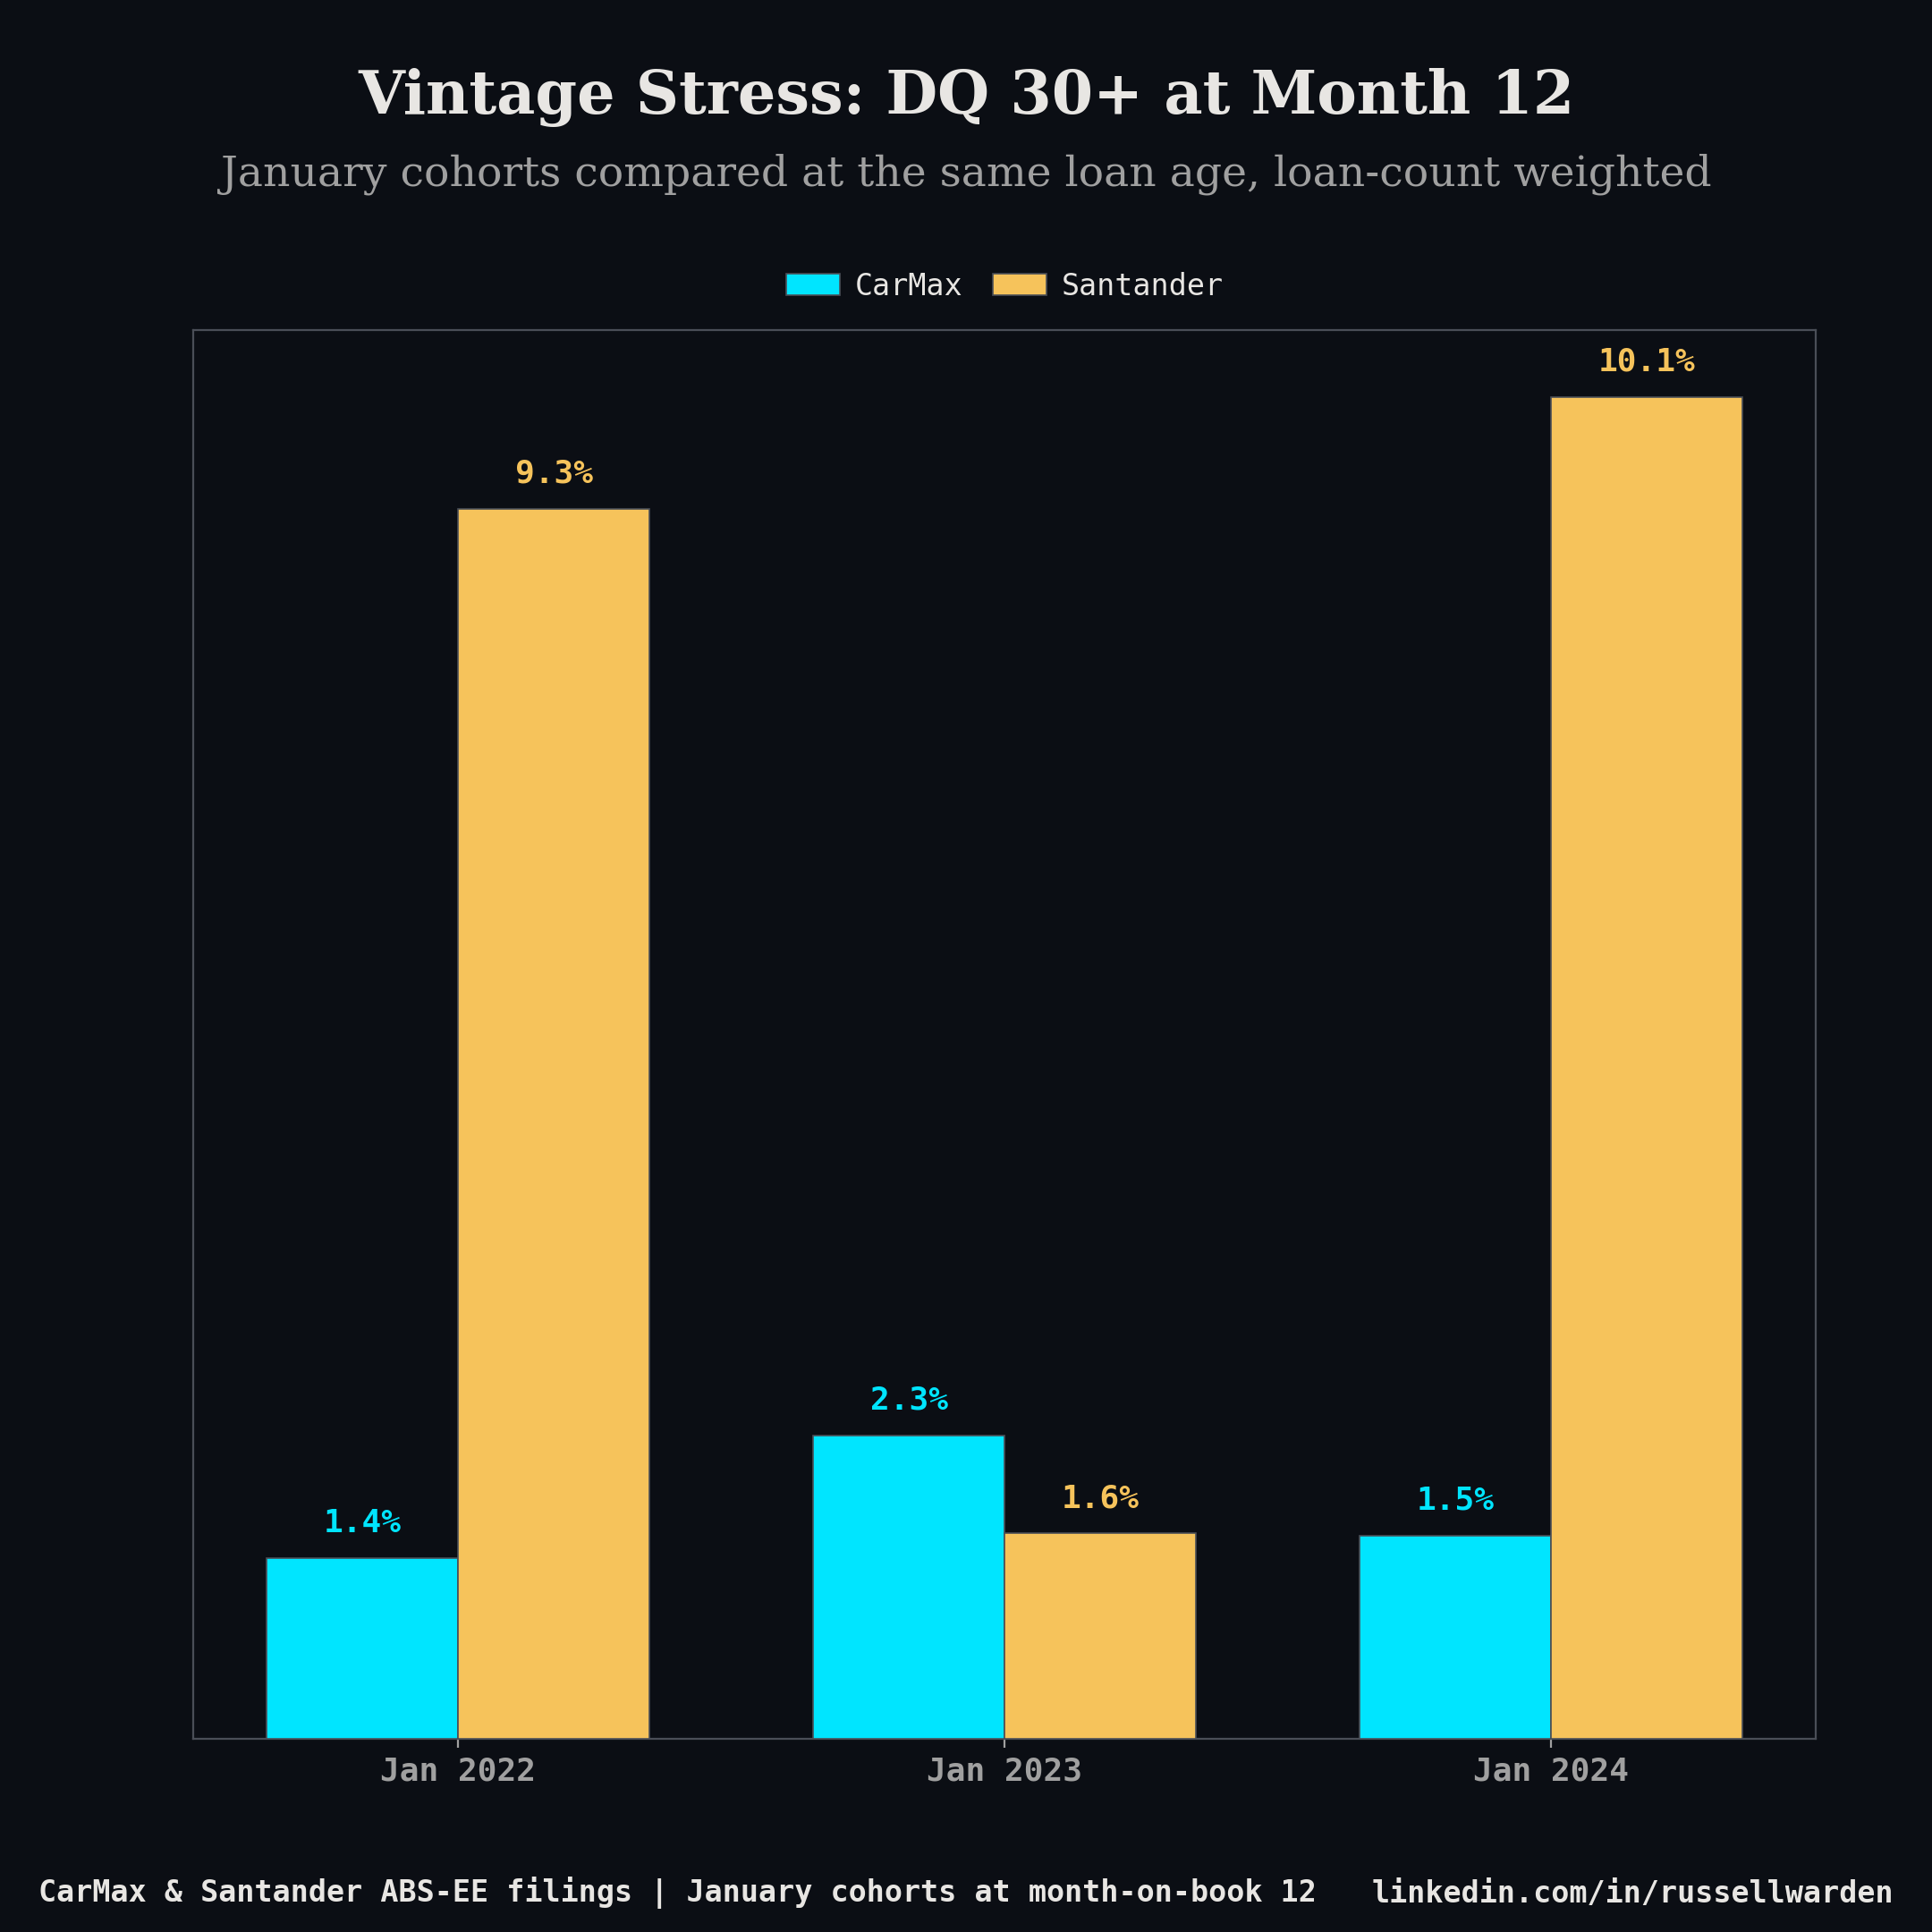
CarMax's 2024 vintage is performing better than its 2023 cohort at the same age (1.53% vs 2.29%) and roughly in line with 2022 (1.36%). That is a positive signal — whatever drove elevated early delinquency in the 2023 vintage did not carry into 2024 originations.
Santander's 2024 vintage moved the other direction. At 10.12% DQ30+ at month 12, it is the worst January cohort in the dataset, exceeding even the 2022 vintage (9.28%). By month 24, the 2024 cohort has already accumulated 12.53% cumulative losses — approaching the 2022 vintage's 14.15% at the same age but with a higher current delinquency rate (10.73% vs 8.57%). If roll rates hold, the 2024 cohort is on track to produce the highest cumulative loss frequency of any recent Santander vintage.
The Santander January 2023 cohort stands out as an anomaly at 1.55% DQ30+, well below the 9-10% range of the 2022 and 2024 vintages. That likely reflects a different deal structure or pool composition for that specific origination month rather than a market-wide shift. It held through month 24 at 1.78%, confirming it as a genuinely cleaner cohort rather than a timing artifact.
Cumulative losses by month 24:
| Vintage | CarMax CLF | Santander CLF |
|---|---|---|
| Jan 2022 | 1.58% | 14.15% |
| Jan 2023 | 2.97% | 2.46% |
| Jan 2024 | 2.39% | 12.53% |
CarMax's 2023 vintage has the highest cumulative loss frequency at month 24 (2.97%), despite the 2024 vintage showing better early DQ performance. That gap — worse losses despite lower delinquency — can happen when charge-off severity is higher even as frequency improves. The 2024 vintage at 2.39% is tracking below 2023 so far.
What to watch next
Two signals are worth tracking from here.
First, Santander's 60+ rate. A rising 60+ rate alongside a flat 30+ rate means the roll rate from 30-59 to 60+ is increasing. If that continues through Q1 2026, it will start showing up in charge-off numbers by mid-year.
Second, the 2024 Santander vintage's loss curve. At month 24 it has already accumulated 12.53% cumulative losses with a 10.73% current DQ30+ rate. The 2022 vintage was at 14.15% losses but only 8.57% DQ30+ at the same point. Higher current delinquency with similar loss accumulation means the 2024 curve has more room to steepen.
We update these metrics monthly as new ABS-EE filings are parsed. The full loan-level dataset with FICO stratification and vintage curves across all issuers is available through our data subscriptions.