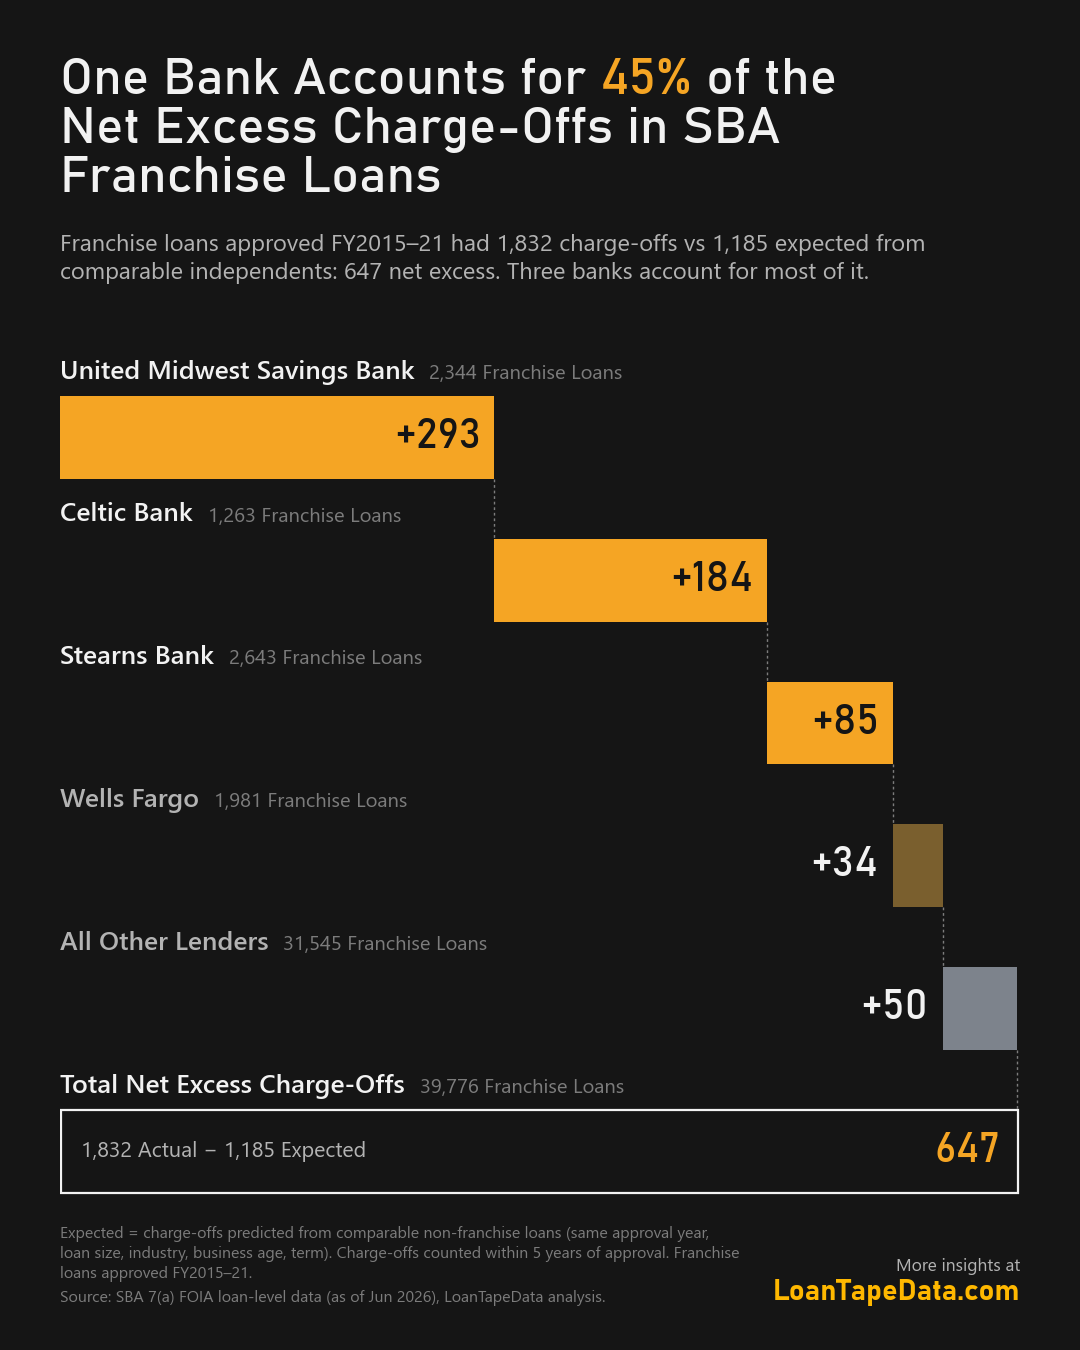
SBA 7(a) franchise loans approved from FY2015 through FY2021 had 1,832 charge-offs within five years of approval. Comparable non-franchise loans imply 1,185. The difference, 647 charge-offs, is the net excess.
United Midwest Savings Bank accounts for 293 of those 647, or 45%. Add Celtic Bank (184) and Stearns Bank (85) and three lenders account for 563, or 87%. Those three made 6,250 of the 39,776 franchise loans in the period, about 16%.
Net, not gross
The 647 is a net figure. Some lenders' franchise loans charged off more than expected and others less. Lenders above expected add up to about 969 excess charge-offs, offset by about 323 from lenders below expected. On a gross basis, United Midwest accounts for about 30% of the positive excess and the three lenders together about 58%.
"Comparable" means non-franchise loans with the same approval year, loan size bucket, three-digit industry, business age and term bucket.
How concentrated is it?
One way to test concentration is to remove the largest contributors and recompute.
| Removed | Franchise charge-offs vs comparable independents |
|---|---|
| Nothing | 1.5x |
| Top 3 lenders (about 6,250 loans) | 1.1x |
| Top 5 lenders | 1.0x |
| Top 3 brands | 1.5x |
| Top 100 brands | 1.05 |
| Top 148 brands (about 6,300 loans) | 0.94 |
Ranking by excess and then removing the top of the ranking lowers the ratio partly by construction, so this table measures concentration, not cause. As a benchmark, the same exercise on independent loans, which sit at 1.0x by definition, takes the ratio to 0.87 after removing three lenders.
The comparison shows how the excess is distributed. Three institutions hold most of it. Matching that brand by brand takes about 150 brands.
The same lenders on independent loans
The three lenders also charged off above expected on their non-franchise loans:
| Lender | Independent loans vs expected | Franchise loans vs expected |
|---|---|---|
| Celtic Bank | 2.3x | 4.6x |
| United Midwest Savings Bank | 2.5x | 4.3x |
| Stearns Bank | 1.6x | 1.8x |
| Huntington | 0.82 | 0.97 |
| Live Oak | 0.83 | 0.92 |
| JPMorgan Chase | 0.95 | 0.71 |
Across 140 lenders with enough loans in both books, franchise loans did worse than the same lender's own non-franchise loans at about half (70 of 140).
Where the three lenders' franchise loans went
United Midwest's franchise lending grew from 128 loans in FY2017 to 766 in FY2021, about 11% of all SBA franchise loans that year. Its 2,343 franchise loans in FY2015-21 went to 373 brands, with a median loan of $150,000, mostly home-service franchises. They had 381 charge-offs against 88 expected.
| Brand (United Midwest loans) | Loans | Charge-offs | Expected |
|---|---|---|---|
| The Grounds Guys | 107 | 31 | 2.5 |
| Mr. Appliance | 64 | 21 | 4.5 |
| Window Genie | 38 | 14 | 0.93 |
| Five Star Painting | 40 | 8 | 0.96 |
| Naturals2Go | 67 | 4 | 7.1 |
| Ace Handyman Services | 32 | 3 | 4.3 |
Not every brand ran above expected. Naturals2Go and Ace Handyman Services came in below.
The three lenders' excess sits mainly in loans to young brands. On brands with 200 or more prior SBA loans, their franchise loans ran at 0.67 of expected, on a small base of 436 loans. On brands with fewer than 50 prior SBA loans, they ran at about 3.7 to 4.0 times expected. The brand-maturity post has the full curve.
Timing
Franchise loans tracked comparable independents through FY2014, at about 1.0x. Celtic and Stearns increased franchise lending in FY2015-16 and United Midwest from FY2017. Together they reached 19% of SBA franchise loans in FY2019. Excluding the three, franchise loans ran at 0.93 for FY2015-16 and between 1.14 and 1.29 for FY2017-20, so they drove most of the rise but not all of it.
By calendar year, franchise charge-offs ran 1.2 to 1.7 times comparable independents from 2016 through 2024. In 2025 the ratio fell to 1.0, and in the first half of 2026 to 0.82. On loans approved through FY2023, franchise charge-offs rose from 1.7% to 2.4% annualized between 2025 and early 2026 while comparable independent loans rose from 1.7% to 2.7%. The gap closed mostly because comparable independent loans charged off more.
What this does not show
This is observational data. It shows where excess charge-offs sit, not why. The lender, brand and borrower are chosen together, and the SBA file carries no underwriting detail beyond the fields used here. Lender names are taken from the SBA file. Every bank named in this post maps to a single FDIC certificate.
The loan-level lender, franchise and charge-off fields are in the SBA 7(a) dataset.
The deep dive
This is the last of four posts from a 19-page deep dive on SBA franchise risk. It includes the lender scatter, the full United Midwest brand table, the timeline and the methodology. Preview the SBA franchise deep dive, or see the SBA plans.
Methodology
Source: SBA 7(a) FOIA loan-level data as of June 30, 2026, funded 7(a) loans approved FY2015-21. Charge-offs counted within five years of approval. Expected charge-offs come from non-franchise loans in the same approval year, size bucket, NAICS three-digit industry, business age and term bucket; 1,066 franchise loans (2.6%) had no comparable group and are excluded. Lender and brand rankings are by each group's own excess. FY2020-21 windows include the COVID period.