From January 2022 through May 2023, between 13% and 15% of SBA 7(a) loans each month carried a franchise code. By October 2023 the share was about 9%. Between October 2024 and February 2025 it bottomed near 6%. In May 2025 it climbed back to 12%, and it has run between about 11% and 18% since.
Loan volume did not fall over that stretch. SBA approved more 7(a) loans in FY2024 and FY2025 than in FY2023. What changed was the label.
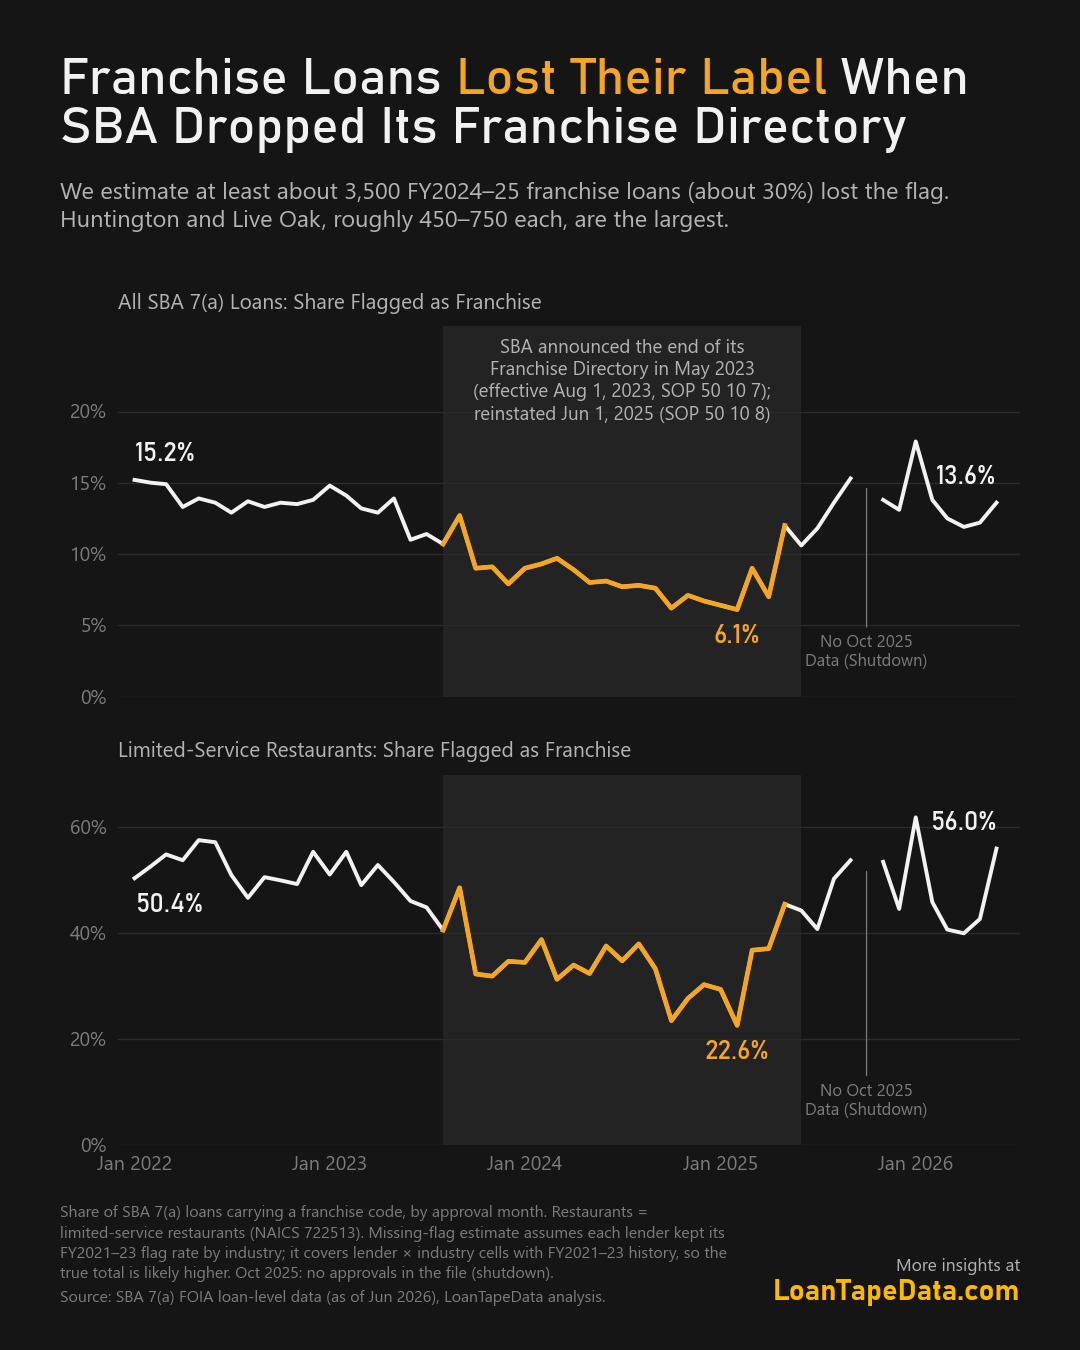
What happened to the franchise label
SBA announced in May 2023 that it would stop maintaining its Franchise Directory. The change took effect with SOP 50 10 7 on August 1, 2023. The directory came back on June 1, 2025, under SOP 50 10 8, which again ties franchise eligibility for SBA financing to the directory listing.
The monthly franchise share follows those dates closely. It starts sliding in June 2023, a month after the announcement, drops to about 9% in October 2023 and recovers from May 2025. The October 2025 gap in the chart is real: the loan file has no approvals between October 1 and November 12, 2025, during the government shutdown.
The drop is sharper in industries where most borrowers are franchisees. In limited-service restaurants (NAICS 722513), about half of SBA loans carried a franchise code in 2022. During the gap the share ran between 23% and 35%. Since mid-2025 it has been back between 45% and 55%.
How many loans lost the label
To size the gap, I took each lender's franchise share in FY2021-23 within each six-digit industry and applied it to that lender's FY2024-25 loans. If lenders had kept flagging at their earlier rates, about 3,500 more FY2024-25 loans would carry a franchise code. That is roughly 28% of the franchise loans the earlier rates imply.
Treat 3,500 as a floor. The estimate only covers lender and industry combinations that existed in FY2021-23. New lenders and new industries in FY2024-25 are not in it.
| Approval year | Flagged as franchise | Expected at FY2021-23 rates | Estimated missing |
|---|---|---|---|
| FY2023 | 5,581 | 5,671 | about 90 |
| FY2024 | 4,084 | 5,897 | about 1,800 |
| FY2025 | 4,729 | 6,400 | about 1,700 |
| FY2026 (to June) | 3,556 | 3,462 | none |
The gap is concentrated. Huntington and Live Oak each account for roughly 450 to 750 of the missing flags, depending on which base years are used. Live Oak recorded 221 franchise loans in FY2023, none in FY2024 and 325 in FY2025.
What it means for franchise comparisons
A franchise flag that switches off for two years changes any comparison built on it. Franchise loans approved in FY2024 and FY2025 land in the "non-franchise" group, and which lenders kept flagging decides who stays in the franchise group.
This came up after my May post on franchise restaurant delinquency. A franchise-data specialist pointed out on LinkedIn that SBA franchise reporting had dropped off sharply for large lenders between 2023 and 2025. The data supports that point.
So I re-ran the restaurant comparison by approval year, using the March 2026 SBA file:
| Approval years | Franchise delinquent | Non-franchise delinquent |
|---|---|---|
| FY2021 and earlier | 5.0% | 3.2% |
| FY2022-23 (flag intact) | 8.3% | 3.8% |
| FY2024-25 (flag gap) | 2.6% | 1.7% |
Delinquent here means delinquent or past due as a share of approved dollars on active loans. The gap is widest in FY2022-23, when the flag was still reliable. The May result holds on the years the label can be trusted, though the size of the gap depends heavily on lender, which the full deep dive covers.
How to work with the flag
For franchise work on SBA 7(a) data, I now:
- treat FY2024 and FY2025 franchise flags as incomplete, and run franchise comparisons on approvals through FY2023 or from mid-2025 on
- check flag rates by lender before comparing lenders, since a lender with no franchise loans in one year may simply have stopped coding them
- read any 2024-25 drop in "franchise lending" as a reporting change first
The loan-level file behind these numbers, including the franchise code, lender and status fields, is in the SBA 7(a) dataset.
The deep dive
This is the first of four posts from a new 19-page deep dive on SBA franchise risk. It covers brand maturity, 22 well-known brands, the lenders behind the excess charge-offs, and where franchise risk stands in 2026. Preview the SBA franchise deep dive, or see the SBA plans.
Methodology
Source: SBA 7(a) FOIA loan-level data as of June 30, 2026. Franchise means the loan carries an SBA franchise code. Monthly shares are by approval date. The missing-flag estimate applies each lender's FY2021-23 franchise share within each six-digit NAICS code to its FY2024-25 loans. The restaurant table uses the March 2026 SBA release, the only recent release with delinquency detail, for NAICS 722511 and 722513.