SBA 7(a) franchise loans approved from FY2015 through FY2021 had 1,832 charge-offs within five years. Comparable non-franchise loans imply 1,185. That is 1.5 times expected.
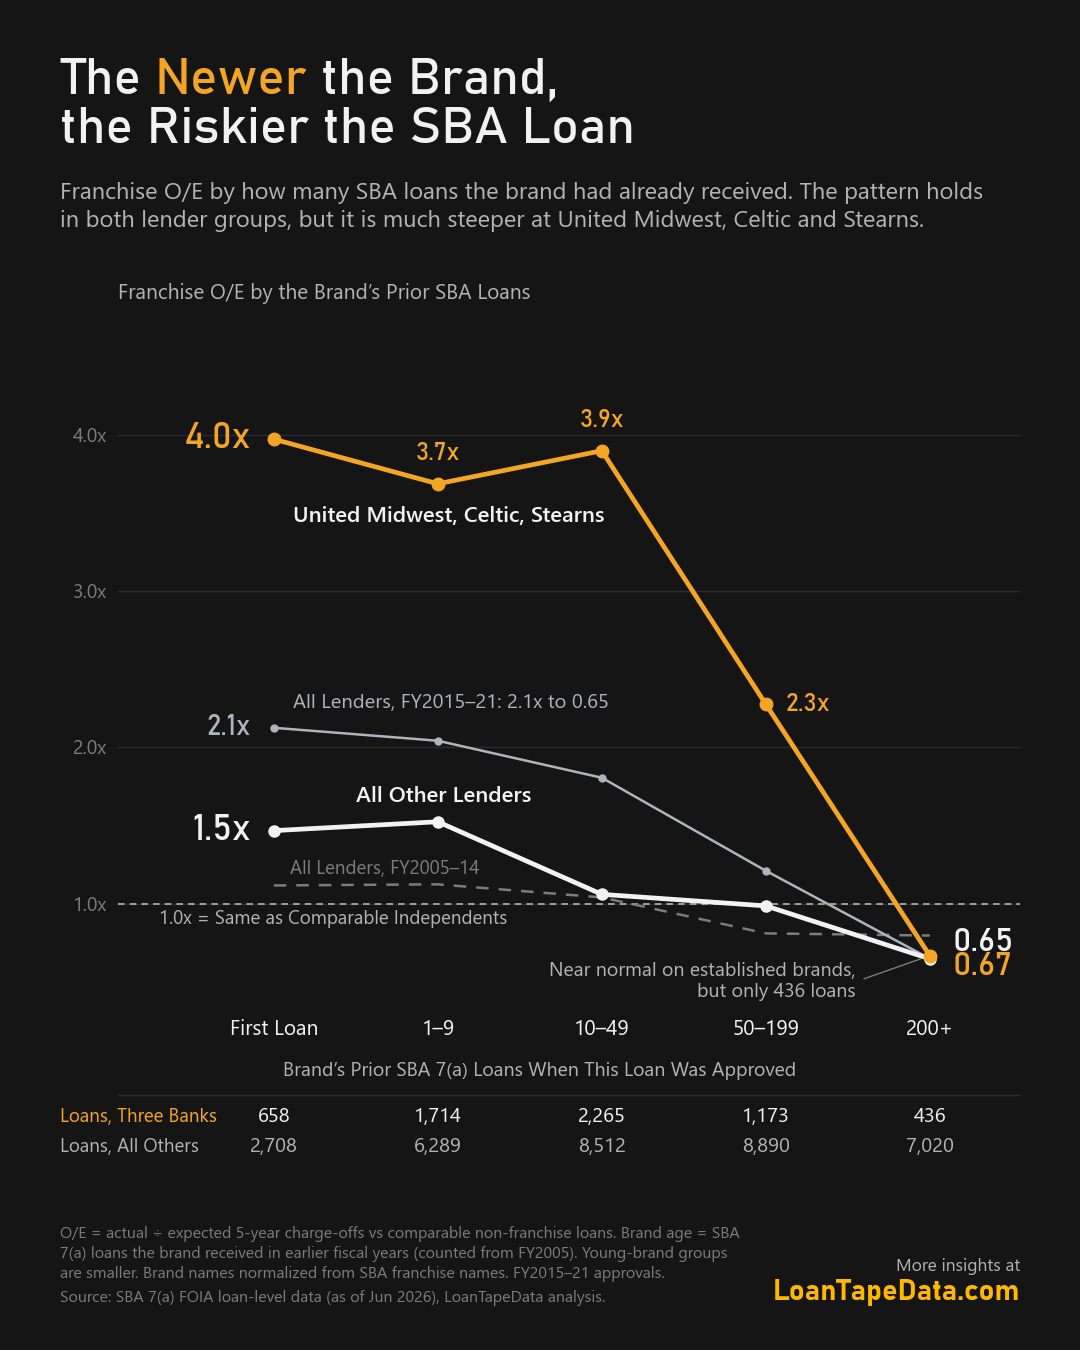
That average combines two different groups. Loans to brands getting their first SBA loan charged off at 2.1 times comparable independents. Loans to brands with 200 or more prior SBA loans charged off at 0.65 times.
How "comparable" works
Each franchise loan gets an expected charge-off rate from non-franchise loans with the same approval year, loan size bucket, three-digit industry, business age (new, existing or change of ownership) and term bucket. A ratio of 1.0x means franchise loans charged off at the same rate as those comparable independent loans. Charge-offs are counted within five years of approval.
Brand track record
For each franchise loan, I counted how many SBA 7(a) loans the same brand had received in earlier fiscal years, starting from FY2005.
| Brand's prior SBA loans | Franchise loans | Charge-offs vs comparable independents |
|---|---|---|
| None (first loan) | 3,366 | 2.1x |
| 1 to 9 | 8,003 | 2.0x |
| 10 to 49 | 10,777 | 1.8x |
| 50 to 199 | 10,063 | 1.2x |
| 200 or more | 7,456 | 0.65 |
The pattern holds in both lender groups I tested, all lenders except three and the three lenders with the largest excess (United Midwest Savings Bank, Celtic Bank and Stearns Bank). It is much steeper at the three: about 4.0x on first-loan brands. At 200 or more prior loans they ran at 0.67, on 436 loans. A later post in this series covers those lenders.
For FY2005-14 approvals the same curve is flatter, between about 0.8 and 1.1. The brand-maturity gap is largely a post-2015 pattern.
Well-known brands
The same result shows up from the other direction. I took every brand with at least 300 SBA 7(a) loans from FY2005-21 from at least 20 different lenders, and excluded hotels, which have too few expected charge-offs to measure. That leaves 22 brands. Twenty of them charged off at or below comparable independents.
| Brand | SBA loans | Charge-offs vs comparable independents |
|---|---|---|
| Orangetheory Fitness | 371 | 0.07 |
| Servpro | 462 | 0.13 |
| Dunkin' | 513 | 0.22 |
| Sport Clips | 721 | 0.26 |
| Subway | 2,462 | 0.34 |
| The UPS Store | 1,012 | 0.46 |
| Anytime Fitness | 914 | 0.79 |
| Domino's | 443 | 1.0x |
| Cold Stone Creamery | 578 | 1.4x |
| Quiznos | 927 | 1.5x |
Quiznos and Cold Stone Creamery are the only two of the 22 above 1.0x. Most of their SBA loans were approved before 2010.
Within these 22 brands, the difference between lenders financing the same brand is no larger than chance would produce. When the concept is established, the lender's choice adds little measurable risk. The lender matters more when the brand has little track record.
By industry
Brand maturity overlaps with industry. Among FY2015-21 franchise loans:
| Industry | Franchise loans | Charge-offs vs comparable independents |
|---|---|---|
| Specialty trade contractors (HVAC, plumbing) | 1,011 | 4.5x |
| Business and building services | 2,082 | 2.2x |
| Repair and maintenance (auto, appliance) | 1,491 | 2.2x |
| Fitness and recreation | 3,683 | 1.4x |
| Restaurants and food service | 10,467 | 1.3x |
| Gas stations | 1,651 | 0.60 |
Several home- and business-service categories run two to four and a half times comparable independents. Restaurants carry the largest number of excess charge-offs because they are the largest group, but they run only 1.3x.
What this means for underwriting
For a franchise loan, the label alone says little. In this data, two attributes carry more information than the franchise flag itself:
- how many SBA loans the brand has already received, and how those loans performed
- which lender is making the loan, especially for brands with short track records
The SBA 7(a) dataset carries the franchise code and name on every loan, so a brand's SBA history can be pulled directly.
The deep dive
This post draws on a new 19-page deep dive on SBA franchise risk. It includes the full brand table, the industry breakdown and the lender analysis. Preview the SBA franchise deep dive, or see the SBA plans.
Methodology
Source: SBA 7(a) FOIA loan-level data as of June 30, 2026, funded 7(a) loans. Expected charge-offs come from non-franchise loans in the same approval year, size bucket, NAICS three-digit industry, business age and term bucket. Brand names are normalized from SBA franchise names (case, punctuation, suffixes and known variants). Prior SBA loans are counted by fiscal year from FY2005. FY2021 loans have 57 to 60 months of history for about 40% of loans.